India supplied 36.1% of Ethiopia’s pharmaceutical imports in 2023, worth $244.7 million out of a total $677.9 million HS 30 import bill, according to UN Comtrade data reported through the World Bank’s World Integrated Trade Solution (WITS, reporter: Ethiopia, 2023). No other single country came close: the United States was second at $101.2 million, Belgium third at $89.3 million.
That single fact, one country supplying more than a third of the medicine entering Ethiopia, sets up the questions procurement officers and foreign manufacturers ask most: where the rest comes from, how the mix has shifted since the birr floated in July 2024, and how exposed the country is to a disruption in any one supplier relationship. This piece works through the customs data, using Ethiopia’s own reported figures wherever they exist and clearly labelled partner-side estimates where they do not.
How much Ethiopia imports, and who supplies it
HS chapter 30 covers pharmaceutical products: packaged medicines, vaccines and blood products, dressings, and other pharmaceutical goods. Ethiopia’s reported imports under this chapter moved between $531.5 million (2013) and $812.0 million (2021) over the past decade, and stood at $677.9 million in 2023, the most recent year Ethiopia has fully reported to Comtrade. Ten countries account for 91.9% of that figure.
| Rank | Country | Imports, 2023 (US$ million) | Share of total |
|---|---|---|---|
| 1 | India | $244.7m | 36.1% |
| 2 | United States | $101.2m | 14.9% |
| 3 | Belgium | $89.3m | 13.2% |
| 4 | China | $67.9m | 10.0% |
| 5 | Netherlands | $40.0m | 5.9% |
| 6 | Italy | $26.5m | 3.9% |
| 7 | Korea, Rep. | $21.8m | 3.2% |
| 8 | Germany | $12.5m | 1.8% |
| 9 | Turkey | $9.5m | 1.4% |
| 10 | Thailand | $9.5m | 1.4% |
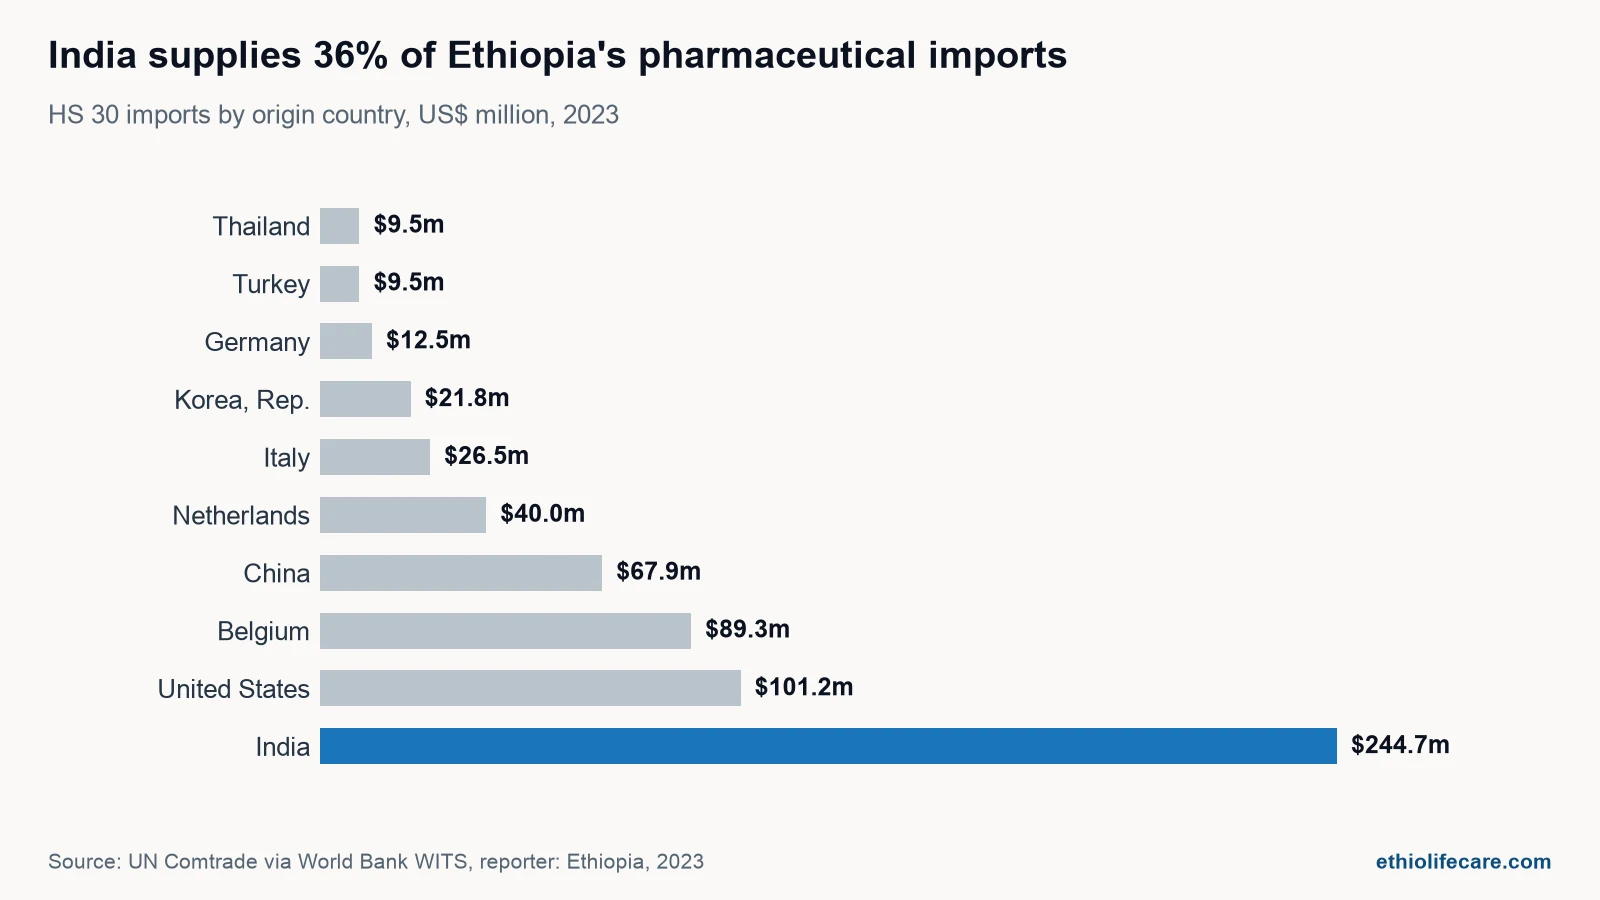
Two entries on that list are worth a note. Belgium and the Netherlands are major European pharmaceutical logistics and re-export hubs rather than primary manufacturing bases for everything that ships from them, so a shipment recorded as originating in Rotterdam or Antwerp may have been made elsewhere and routed through a distribution centre. That does not change the customs value, but it does mean “Belgium” and “Netherlands” here describe a trade route as much as a factory address. African suppliers barely register by comparison: Egypt, Kenya and South Africa combined sold Ethiopia $5.4 million of pharmaceuticals in 2023, 0.8% of the total. Regional supply is not yet a meaningful alternative to Asian and European sourcing.
What’s inside the number: medicines, vaccines, dressings, and instruments
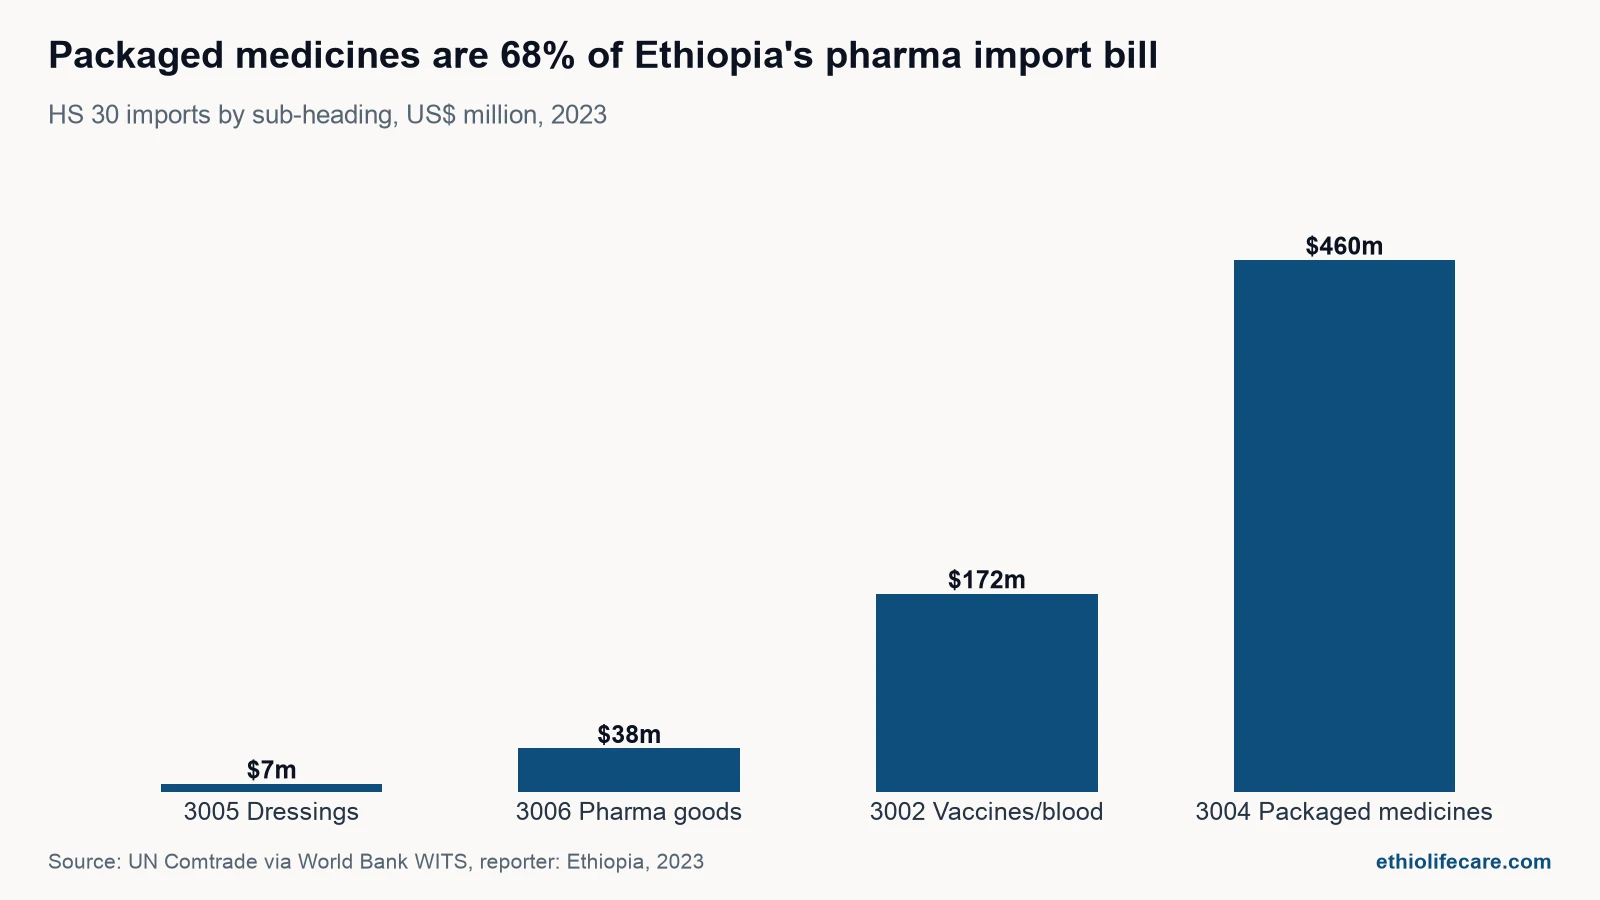
HS 30 splits into four sub-headings, and the split shows where the money actually goes.
| HS code | Category | Imports, 2023 (US$ million) | Share of HS 30 total | Top supplier |
|---|---|---|---|---|
| 3004 | Packaged medicines (measured-dose, retail-ready) | $460.1m | 67.9% | India, $189.4m |
| 3002 | Vaccines, blood products, antisera | $171.6m | 25.3% | Belgium, $86.1m |
| 3006 | Pharmaceutical goods (first-aid kits, contraceptives, etc.) | $37.8m | 5.6% | Netherlands, $13.8m |
| 3005 | Dressings, gauze, wadding, adhesive plasters | $7.2m | 1.1% | China, $4.8m |
Packaged medicines dominate, and India leads that sub-heading too, though by a narrower margin than the headline number suggests: $189.4 million against the United States’ $95.2 million. Vaccines and blood products, a quarter of the whole chapter, flip the supplier order: Belgium leads, India is a distant second at $43.1 million, and Korea is third at $20.7 million. Vaccine and biologic supply chains route through a smaller number of specialised European and East Asian manufacturers and cold-chain operators, a different pattern from the generic tablets and capsules that make up most of 3004.
Medical instruments sit in a different HS chapter
Medical, surgical and dental instruments and appliances (HS 9018) are not part of chapter 30 at all; they sit in HS chapter 90 alongside optical and measuring equipment. Ethiopia imported $86.1 million of them in 2023, and the supplier order is the reverse of packaged medicines: China led with $40.2 million (46.7%), India followed at $11.1 million, then the United States, Germany, the Netherlands and the UAE. Buyers sourcing devices and disposables should not assume their pharmaceutical supplier’s country mix applies; our buyer’s guide to medical equipment imports covers the device-specific questions.
A decade of shifting suppliers: 2013 to 2023
India has held the number one or number two position in every year Comtrade has recorded since 2013, and 2023’s $244.7 million is its highest figure in the series. That is the one stable trend line in an otherwise volatile decade.
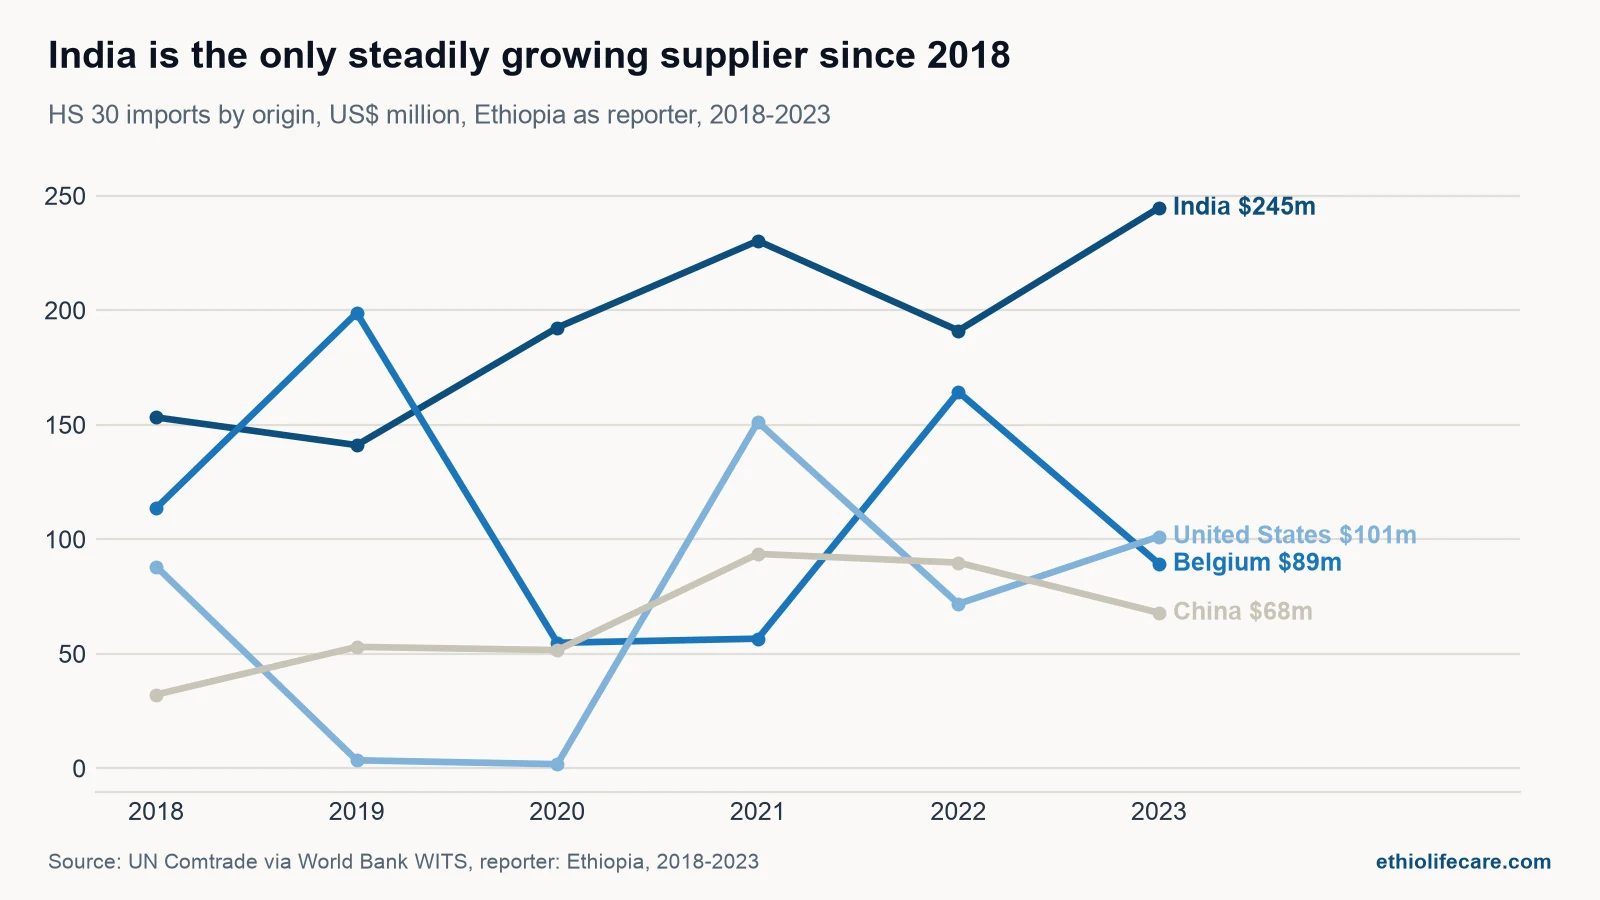
The other three lines are far less orderly. The United States collapsed to near zero in 2019 and 2020 ($3.5 million and $1.8 million) before jumping to $151.2 million in 2021, a pattern consistent with large, lumpy institutional or donor-linked shipments rather than steady commercial trade. Belgium moved from $198.8 million in 2019 to roughly $55 million across 2020 and 2021, back to $164.3 million in 2022, then down to $89.3 million in 2023, a re-export hub’s volumes shifting with whatever routes through it that year. China is the newest entrant to consistent top-five status, absent from the leading suppliers in 2013 and 2018 (roughly $23 million and $32 million, both outside the top five) but present every year from 2019 onward, peaking at $93.6 million in 2021.
Ten years ago, in 2013, the top five were India ($137.9m), Netherlands ($135.7m), Belgium ($53.4m), United States ($50.6m) and Italy ($26.0m), with China nowhere near that list. India did not lose ground to Europe over the decade; China simply arrived as a third force alongside a still-dominant India and a volatile European logistics layer.
How concentrated is Ethiopia’s supply, and how does Kenya compare
A country that buys more than a third of its medicine from one supplier carries a different risk profile from one that spreads purchases evenly. Two standard measures capture that: the combined share of the top three suppliers, and the Herfindahl-Hirschman Index (HHI), the sum of every supplier’s squared percentage share across the market. HHI weights big suppliers more heavily than small ones, since squaring a large number grows faster than squaring a small one, so it catches concentration a simple top-three count can miss.
Run across Ethiopia’s full 69-country supplier list for HS 30 in 2023, the top three (India, United States, Belgium) hold 64.2% between them, and the HHI comes to 1,871. Kenya, using the same Comtrade methodology for the same year, is a useful comparison: a similar income level, similar import dependence, and India as its largest supplier too.
| Measure | Ethiopia, 2023 | Kenya, 2023 |
|---|---|---|
| Total HS 30 imports | $677.9m | $614.6m |
| Top supplier | India, 36.1% | India, 44.7% |
| Top-3 share | 64.2% | 62.4% |
| HHI (all suppliers) | 1,871 | 2,253 |
The two countries look similar on top-three share, but the HHI tells a sharper story: Kenya’s supply is more concentrated, because India alone holds 44.7% of the Kenyan market against 36.1% in Ethiopia. Ethiopia’s slightly wider spread across the United States, Belgium and China pulls its score down even though it leans on the same top supplier. Neither sits comfortably against conventional thresholds (HHI above 1,500 reads as moderately concentrated, above 2,500 as highly concentrated), but Ethiopia’s exposure to a single-country shock is, on this measure, somewhat lower than its regional peer’s.
Why WHO prequalification and stringent-authority approval shape sourcing
The country mix above is not only a function of price and manufacturing capacity. Ethiopia’s registration rules build in an incentive to buy from manufacturers who already carry international clearance. EFDA’s Guideline for WHO Collaborative Registration Procedure (document EFDA/GDL/021, its legal basis set out in article 26 of Medicine Marketing Authorization Directive 963/2023) commits the authority to grant a Marketing Authorization Certificate within 90 days for products that already hold WHO prequalification and are submitted with a complete dossier, faster than the standard first-time route we cover in our piece on EFDA product registration. Separately, EFDA’s core registration guideline (EFDA/GDL/017) defines and uses the term Stringent Regulatory Authority (SRA) throughout its dossier requirements, letting a comparator or reference product already registered with an SRA such as the US FDA or the European Medicines Agency support parts of an Ethiopian application.
Indian manufacturers hold a large share of WHO-prequalified generic medicines, which helps explain India’s lead in Ethiopia’s imports: a prequalified product clears EFDA’s system faster, independent of price. For a foreign manufacturer weighing entry into the Ethiopian market, WHO prequalification or an existing SRA approval is a registration-speed advantage worth pursuing before, not after, appointing a local agent. Our guide to verifying a medicine supplier in Ethiopia covers how a buyer checks that status on the EFDA register rather than taking a supplier’s word for it.
What forex scarcity and the 2024 float did to import volumes
Ethiopia has not yet submitted full-year 2024 or 2025 trade data to Comtrade, so the 2023 figures above are the most recent complete, Ethiopia-reported picture. To see what happened after the National Bank of Ethiopia floated the birr under Directive FXD/01/2024 on 29 July 2024, we use two other kinds of evidence: partner-reported “mirror” data, and customs-transaction estimates.
Mirror data means using a trading partner’s own reported exports as a stand-in for the number Ethiopia has not yet published, on the logic that one side’s import should roughly match the other side’s export of the same goods. It is an approximation, not a substitute: exporters typically report value free-on-board (FOB, before freight and insurance), while importers report cost-insurance-freight (CIF, after those costs), so mirror figures usually understate the importer’s own number. The gap is visible directly here: India reported exporting $171.4 million of pharmaceuticals to Ethiopia in 2023, about 30% below the $244.7 million Ethiopia reported importing from India that same year. With that in mind, India’s mirrored exports to Ethiopia held roughly steady into 2024 ($167.7 million), China’s rose ($43.5 million to $48.2 million), and Belgium’s stayed close to flat ($90.8 million). The United States figure fell sharply on the mirror side, to $2.3 million in 2024, too large a gap to explain by FOB/CIF alone; we report it because the sources disagree this much, rather than picking a number.
The most current read comes from customs-transaction data rather than Comtrade: Ethiopia imported $160.95 million of pharmaceuticals in the first half of 2025, more than 1,200 transactions, rising from $24.63 million in January to $31.93 million in June (NBD trade data, 24 December 2025). India led at $68.3 million, Belgium at $34.0 million, China at $15.6 million. Doubling that half-year figure gives a rough, illustrative annualised $322 million, well under half of 2023’s $677.9 million Comtrade total; the comparison mixes two data sources, and NBD’s coverage may be narrower than the full HS 30 chapter, so treat it as directional. It lines up with what forex data shows separately: in the months after the float, the Commercial Bank of Ethiopia allocated $282.5 million across four rounds, of which medicines and medical supplies received $208.3 million (73.7%), yet recipients drew down only 28% of it (Addis Insight, 11 October 2024). Currency access improved faster than completed import transactions did. We walk through the currency mechanics of a single shipment in how the exchange rate reaches the price of medicine in Ethiopia.
What this means for buyers and for manufacturers
For a hospital pharmacy head or wholesale buyer, the concentration numbers argue for treating single-country dependence as a planning problem, not background noise. A supplier whose product line sits entirely with one origin country carries the same currency and shipping-lane risk visible in Belgium’s and the United States’ swings above. Asking a prospective supplier how many origin countries sit behind their catalogue is a fair, specific question, and one most suppliers can answer in a sentence if the answer is genuinely diversified.
For a foreign manufacturer weighing Ethiopia, the practical sequence is registration before volume. WHO prequalification or an existing SRA approval shortens the path through EFDA, and the choice of local agent then determines how much of that speed advantage is preserved. Our walkthrough of how to import medicine into Ethiopia covers the steps from competence certificate to port clearance.
Frequently asked questions
Which country supplies the most medicine to Ethiopia?
India, by a wide margin. Ethiopia imported $244.7 million of pharmaceutical products (HS 30) from India in 2023, 36.1% of the $677.9 million total, according to UN Comtrade data reported through the World Bank’s WITS platform. India has held the number one or number two position among Ethiopia’s suppliers every year since at least 2013.
How much does Ethiopia import from China compared with India?
China supplied $67.9 million of pharmaceutical products in 2023, 10.0% of Ethiopia’s total HS 30 imports, roughly a quarter of India’s $244.7 million. The gap narrows in medical instruments and devices (HS 9018, a separate chapter from pharmaceuticals), where China led with $40.2 million against India’s $11.1 million in the same year.
Why doesn’t Ethiopia’s 2024 or 2025 import data show up in UN Comtrade yet?
Comtrade relies on each country submitting its own customs data, and Ethiopia had not yet submitted full-year 2024 or 2025 pharmaceutical figures as of this analysis. Analysts fill that gap with “mirror” data, using partner countries’ reported exports to Ethiopia as an estimate, though those figures typically run lower than Ethiopia’s own eventual numbers because exporters report free-on-board value while importers report cost-insurance-freight value, which adds shipping and insurance.
Did the 2024 birr float reduce Ethiopia’s medicine imports?
The available evidence points that way without offering a precise year-on-year figure, because the pre-float and post-float data come from different sources. Customs-transaction data shows $160.95 million in pharmaceutical imports for the first half of 2025, an annualised rate well under half of 2023’s $677.9 million Comtrade total. Separately, the Commercial Bank of Ethiopia allocated $208.3 million in foreign exchange to medicines and medical supplies in the months after the July 2024 float, but recipients used only 28% of that allocation, suggesting currency access improved faster than the volume of completed import transactions did.
Is Ethiopia more or less dependent on a single supplier country than other African markets?
Somewhat less, by one standard measure. Ethiopia’s Herfindahl-Hirschman Index for HS 30 imports in 2023 was 1,871; Kenya’s, calculated the same way from the same Comtrade data for the same year, was 2,253, driven by India’s larger 44.7% share of the Kenyan market against 36.1% in Ethiopia. Both countries lean heavily on the same top supplier, but Ethiopia’s imports are spread slightly more evenly across its second and third-largest sources.
Working with a partner sourced from more than one country
LifeCare’s own supply lines run through several countries in the tables above and beyond them: partners include Care Pharma FZ LLC in the UAE, Therdose in India, Grindex in Latvia, and Martindale Pharma in the United Kingdom, alongside our own manufacturing in Addis Ababa. That spread is a practical response to the same concentration risk this data describes. If you manufacture abroad and want to talk through an Ethiopian route to market, or you are buying and need a quote, see how we work with manufacturing partners or tell us what you need and when.