Ethiopians spent USD 34.80 per person on health care in 2023, according to the World Bank’s mirror of the WHO Global Health Expenditure Database (World Bank, 2026). In the last full National Health Accounts round, every 100 birr split roughly 34 from donors, 32 from government, 31 straight out of patients’ pockets and less than one from community insurance. By 2023, WHO’s figures put the patient share at 46. That split, more than any tender notice, decides who buys medicine in Ethiopia and when the money arrives.
This piece pulls together the primary numbers on who pays for health care in Ethiopia: the spending trend, the financing split, the federal budget against the Abuja Declaration target, insurance coverage, catastrophic spending, the 2025 US aid pause, and how Ethiopia compares with its neighbours. Every figure is sourced and dated, and where sources disagree, we say so rather than picking whichever number reads better.
Thirteen years of growth that barely doubled per-person spending
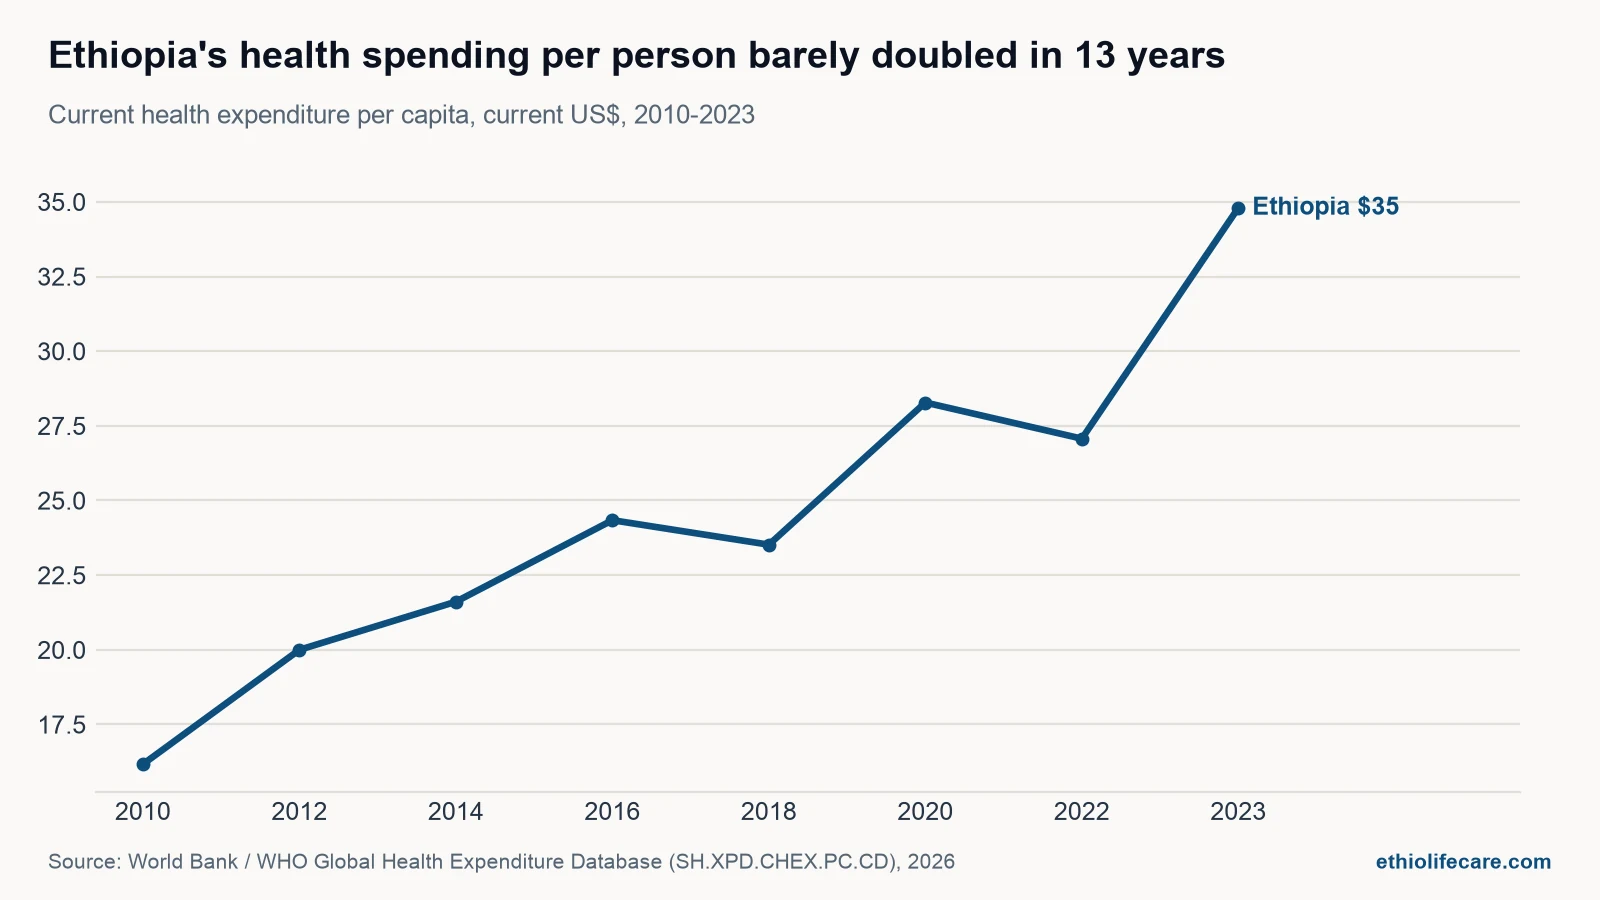
Current health expenditure per capita rose from USD 16.17 in 2010 to USD 34.80 in 2023, about 115% in nominal dollar terms (World Bank/WHO GHED). The path was not smooth: it dipped in 2011, climbed to USD 28.28 by 2020, fell back to USD 26.07 the following year, then jumped in 2023, the sharpest single-year rise in the series. As a share of GDP, spending has actually fallen over the same period, from 5.47% to 2.80%, because Ethiopia’s economy has grown faster than its health budget.
Ethiopia’s own National Health Accounts (NHA) tell a similar story with a longer lens. The eighth round, covering fiscal year 2019/20 and published by the Ministry of Health in April 2022, put per-capita spending at USD 4.50 in 1995/96 and USD 36.40 in 2019/20, including COVID-19 spending (Ministry of Health, NHA VIII, 2022). The NHA report itself flags that this is still low against a USD 43 average for low-income African countries, and far short of the USD 86 per capita the WHO estimated was needed to deliver essential health services, a benchmark set for 2015 and still not reached eight years later.
One caveat worth flagging: the NHA’s own percentage-of-GDP figures (4.2% in 2016/17, rising to 6.3% in 2019/20 including COVID spending) run noticeably higher than the World Bank/GHED series for the same years (around 3.2% to 3.6%). The two use different GDP bases and a different definition of total health expenditure. Both are legitimate; they are simply not the same measurement.
Who actually pays: the 100-birr split
The most recent full financing breakdown comes from NHA VIII, covering 2019/20, when total health expenditure was ETB 127.47 billion (USD 3.63 billion). Here is how it split by source, converted to a notional 100 birr for readability:
| Payer | Share of 100 birr | What that looked like in 2019/20 |
|---|---|---|
| Donors (bilateral and multilateral) | 33.9 birr | ETB 43.21 billion (USD 1.23 billion) |
| Government (federal, regional, woreda) | 32.2 birr | ETB 41.04 billion (USD 1.17 billion) |
| Households, direct out-of-pocket | 30.5 birr | ETB 38.92 billion (USD 1.11 billion) |
| Private employers and other private | 2.5 birr | ETB 3.16 billion (USD 0.09 billion) |
| CBHI (voluntary community insurance) | 0.9 birr | ETB 1.13 billion (USD 0.03 billion) |
Three things stand out. Donors and government are almost tied as the two biggest payers, and patients paying directly are a close third, not a marginal one. CBHI, which has grown quickly in enrolment, still moved under one birr in every hundred in 2019/20. And the split has barely shifted since the previous NHA round in 2016/17, when donors held 35.2%, government 32.0% and households 30.2%: government’s own share moved only from 32.0% to 32.2% in three years, while the share of money it directly manages actually fell, from 52% to 47%, as more flowed through donor- and NGO-managed channels instead.
How much of that 100 birr reaches medicines
This needs careful reading, not a headline lift. NHA VIII’s function breakdown shows “medical goods, not specified by function” at just 2.83% of total health expenditure in 2019/20. Taken at face value, that would suggest almost nothing reaches medicines. It does not mean that. The report’s own glossary explains the catch: this line captures only medicines sold through standalone, independent pharmacies. Medicines dispensed as part of a hospital or health centre visit, which is most of them, are folded into “curative care” spending (55.79% of the total) and not broken out separately, because of what the report calls aggregation problems in the underlying data.
So the honest reading is: standalone retail pharmacies handle a little under 3 birr of every 100 spent on health, and a materially larger, currently unquantified share of medicines spend sits invisibly inside that 56-birr curative care line. Worth noting: the share of NGO-managed resources going to medical goods jumped from 0.4% to 7% between the two NHA rounds, suggesting donor programmes increasingly buy commodities directly rather than funding services generally.
The federal health budget against the Abuja target
Ethiopia’s parliament ratified a record federal budget of ETB 2.34 trillion for the fiscal year that began in July 2026, up 21.3% on the year before, as we covered in our guide to the 2026/27 procurement calendar. A health-specific breakdown of that budget has not been published as of this writing, so the most recent confirmed figures come from UNICEF Ethiopia’s National Health Budget Brief 2024/25, compiling Ministry of Finance data.
Ethiopia’s total health sector budget rose from ETB 100.17 billion in 2023/24 to ETB 143.43 billion in 2024/25, a 43% nominal increase (UNICEF Ethiopia, 2025). But health’s share of the total government budget fell over the same period, from 8.3% to 7.2%, against the 15% target set by the African Union’s 2001 Abuja Declaration; UNICEF puts the decade average at 8.5%, so 2024/25 sits below Ethiopia’s own recent norm too. The birr rise also masks a currency effect: after the July 2024 exchange-rate reform, per-capita health budget in dollar terms actually fell, from USD 16.3 in 2023/24 to roughly USD 11.1 in 2024/25, even as the birr figure rose 24%. For a sector that imports most of its medicines and equipment, that dollar decline matters more than the birr headline.
NHA VIII’s own historical series shows the same pattern further back: government health spending as a share of total government expenditure moved from 5.2% in 1995/96 to a peak of 8.5% in 2019/20, never reaching the 15% Abuja benchmark that the Ministry of Health’s own report cites as its reference point. One bright spot: the health budget’s capital share rose from 32.5% to 41.1% between 2023/24 and 2024/25, and federal capital allocations to health more than doubled, from ETB 16.76 billion to ETB 40.14 billion.
Insurance: CBHI’s slow scale-up and a Social Health Insurance scheme that has just started
Community-Based Health Insurance (CBHI), Ethiopia’s voluntary scheme for the roughly 85% of the population outside formal employment, launched in a handful of woredas in 2010 and had reached 827 woredas by the end of 2019/20 (NHA VIII). By 2024, 11.1 million households, about 73% of eligible households in CBHI woredas, were enrolled: roughly 51 million people, around 46% of the population, using the Ministry of Health’s average household size of 4.6 (Commonwealth Fund, May 2026). The annual premium was ETB 500 (about USD 10) as of 2022, reduced to ETB 240 for dependents over 18 still living at home; a 2022 study found it unaffordable for 38% of households in the South Central region.
Formal-sector workers have waited far longer. A mandatory Social Health Insurance (SHI) scheme, proposed at 3% of monthly salary from employees plus 3% from employers, sat in the pipeline for over a decade, repeatedly delayed by resistance to the payroll deduction. It finally launched on 22 January 2026, but only for public health-sector professionals as a first phase, at a 6% contribution the government has pledged to cover in full for health-sector civil servants (Capital Ethiopia, 25 January 2026). At the time of that report, only 170,000 of an estimated 500,000 public health facility employees, about 24%, had registered, with inconsistent regional fees flagged as the main threat to the rollout. Private health insurance, separately, covers only about 1% of Ethiopians, almost entirely as an employer-paid benefit.
What catastrophic spending looks like in the data
With out-of-pocket payments this high, the next question is how often a medical bill pushes a household into financial distress. A 2025 peer-reviewed study using the nationally representative 2018/19 Ethiopia Socioeconomic Survey (6,770 households, 29,503 individuals) found catastrophic health expenditure incidence of 1.49% at the standard 10%-of-total-consumption threshold, rising to 4.69% at a 40%-of-non-food-consumption threshold, and 2.48% under the capacity-to-pay method; 0.83% of households were pushed into poverty by health spending (Tadiwos, Kassahun and Mebratie, Health Economics Review, 2025). Smaller district-level studies report far higher rates, up to 64% among chronic patients at one referral hospital and 22 to 30% in some rural communities, but these describe specific, higher-risk populations, not the national picture.
The 2025 US aid pause and its effect on health commodities
Donors supply roughly a third of Ethiopia’s health financing, so a sudden change in US assistance shows up quickly. On 20 January 2025, the US State Department announced an immediate 90-day pause on US foreign assistance, including PEPFAR-supported HIV programmes, worldwide. In Ethiopia, the Ministry of Health reported that 5,000 US-funded public health worker contracts and 10,000 data-clerk contracts were terminated across all regions, disrupting the entry of treatment data into health information systems (UNAIDS, 6 February 2025). Because PEPFAR funded 100% of Ethiopia’s viral load and Early Infant Diagnosis reagent procurement, the pause directly threatened HIV testing commodity supply. Across three regions alone (Addis Ababa, Oromia and Gambella), UNAIDS reported 2,385 people unable to continue ARV, TB or STI treatment and 14,811 losing HIV testing support, against a national baseline of 503,000 people on ART through 1,400 facilities.
When external funding is a third of the total, a decision taken in another capital reaches an Ethiopian laboratory’s reagent shelf within weeks.
How Ethiopia compares with its neighbours
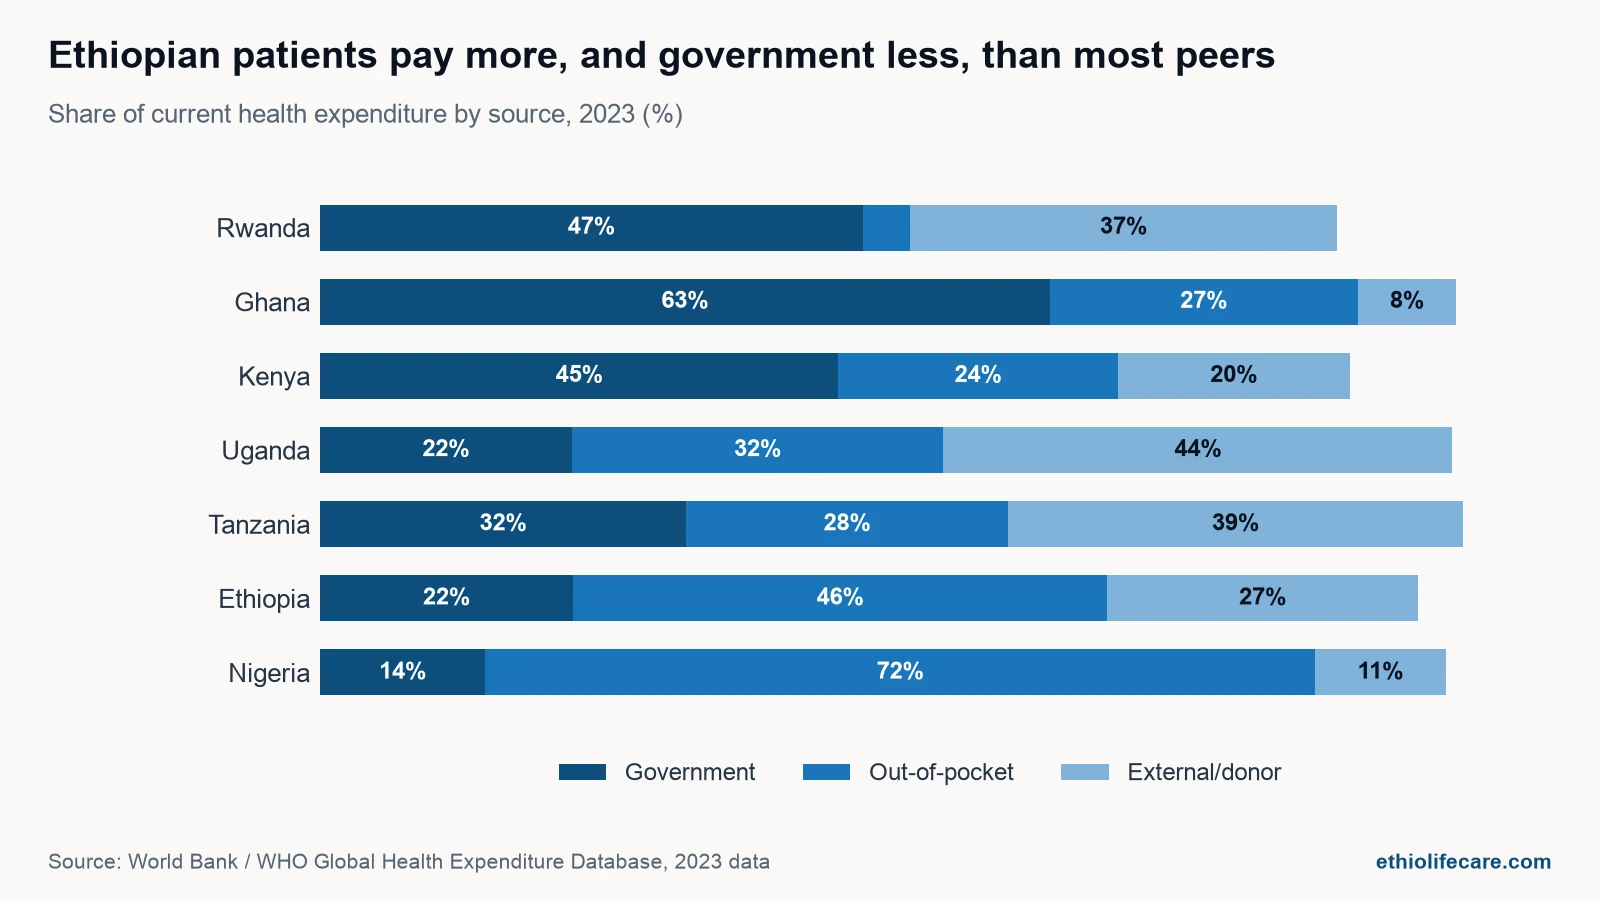
Set against six African peers using the same World Bank/WHO GHED data for 2023, Ethiopia sits at the low end on per-capita spending and the high end on how much of that spending lands on patients directly. Kenya (USD 84.96), Ghana (USD 70.26) and Nigeria (USD 66.82) all spend roughly double Ethiopia’s USD 34.80 per person. Rwanda, at USD 52.66 per capita, protects patients far better than any of them: only 4.1% of its health spending is out-of-pocket, against government’s 47.0% and external assistance’s 37.0% (World Bank/WHO GHED).
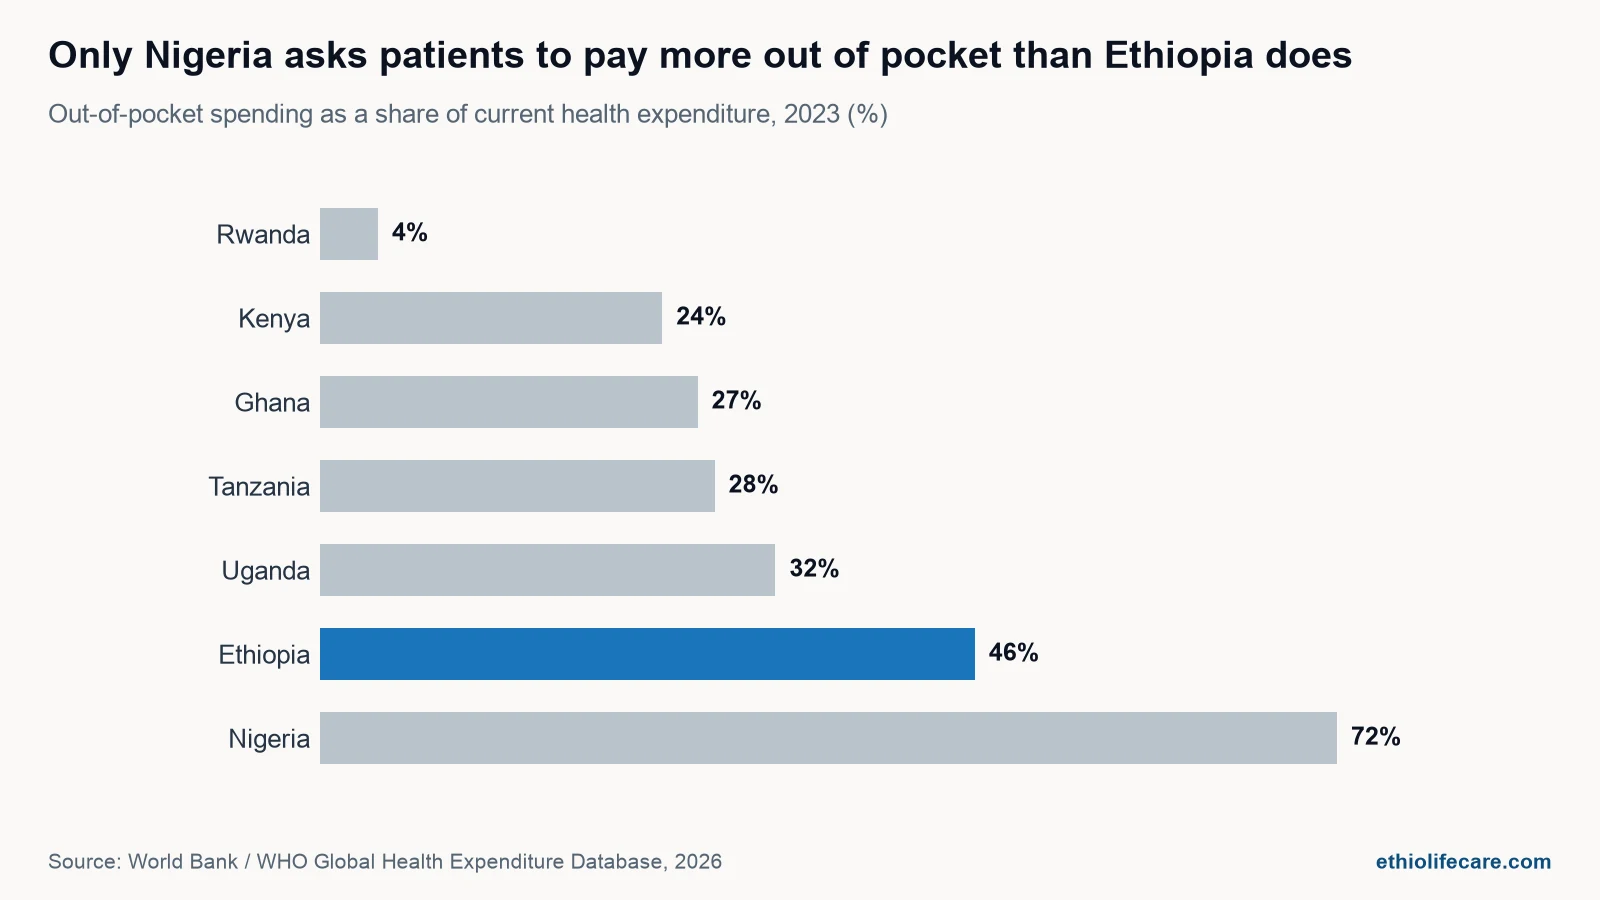
Ethiopia’s 46.3% out-of-pocket share is second only to Nigeria’s 71.9% among this group, well above Tanzania (27.9%), Ghana (26.7%), Kenya (24.2%) and Rwanda (4.1%). On government’s own share, Ethiopia’s 21.9% trails every peer here except Nigeria’s 14.3%. The pattern is consistent: Ethiopia’s health system leans more heavily on households, and less on domestic government revenue, than most of the countries it is usually compared with. On donor funding it sits mid-table, below Uganda, Tanzania and Rwanda. The 46.3% figure is higher than the 30.5% in the 100-birr table above for two reasons. WHO’s database classifies some flows differently from the national accounts, so even for 2019 it shows 37.8% rather than 30.5%. And the share has since climbed, from 33.1% in 2020 to 44.6% in 2022 and 46.3% in 2023. Read the table for the structure and the WHO series for the direction, which is towards households carrying more.
What this means for suppliers
Procurement behaviour in Ethiopia follows the financing split, not the org chart. Four buyer types actually move money for medicine, and each behaves differently.
- EPSS, the public system’s single largest channel. EPSS signed medicine procurement contracts worth ETB 24 billion in the fiscal year just closed, covering 5,000 health facilities, with institutions collecting ETB 16.3 billion against those contracts, a 70% fulfilment rate (EPSS Director-General Abdulqadir Gelgelo, briefing 26 August 2026). The agency has also cut the share of medicines facing inadequate supplier availability from 27% to 16% by registering more suppliers, including for hard-to-source categories like certain cancer drugs. Our guide on becoming an EPSS-approved supplier walks through the process.
- NGOs and donor programmes, which increasingly buy commodities directly rather than funding services generally: the share of NGO-managed money spent on medical goods jumped from 0.4% to 7% in three years. These buyers move fast when funded and stop abruptly when a donor pauses, as the 2025 PEPFAR disruption showed.
- Private hospitals and clinics, a smaller but cash-paying channel, typically procuring in smaller volumes with faster payment cycles than the public system.
- Patients themselves, buying through retail pharmacies. Households paid about 31 birr of every 100 in 2019/20, and 46 by WHO’s 2023 figures, which on the newer data makes them the largest single payer and the one least protected against a bad month. When public supply runs short, this is where the gap gets filled. We cover that dynamic in how private suppliers fill drug shortages in Ethiopia.
A registration on the EFDA register and a supplier number with EPSS get you access to the largest single channel, but the entity that actually pays first, most often, is the patient at the pharmacy counter. A supplier that can serve both, competitive on public tenders and available on the shelf for cash-paying customers, is positioned for how the money in this system actually moves.
Frequently asked questions
How much does Ethiopia spend on health care per person?
USD 34.80 per person in 2023 (World Bank/WHO GHED), up from USD 16.17 in 2010. As a share of GDP, though, health spending has fallen, from 5.47% to 2.80%, because the wider economy has grown faster than the health budget.
Who pays for most of Ethiopia’s health spending?
In the most recent National Health Accounts (2019/20): donors 33.9%, government 32.2%, direct out-of-pocket 30.5%, private employers and other private 2.5%, Community-Based Health Insurance under 1%. Donors and government are nearly tied at the top, with households a close third. WHO’s Global Health Expenditure Database, which runs to 2023, puts the out-of-pocket share at 46.3% that year, which would make households the largest payer on the newer data.
What share of Ethiopia’s budget goes to health, and how does that compare with the Abuja Declaration?
Health’s share of the total government budget was 7.2% in 2024/25, down from 8.3% the year before, according to UNICEF Ethiopia’s health budget brief. The African Union’s 2001 Abuja Declaration set a 15% target for African governments; Ethiopia has never reached it, and the National Health Accounts show a historical peak of 8.5% in 2019/20.
What is CBHI and how many Ethiopians are covered?
Community-Based Health Insurance is a voluntary scheme, launched in 2010, for the roughly 85% of Ethiopians working outside formal employment. By 2024, about 11.1 million households, roughly 46% of the national population, were enrolled. A separate Social Health Insurance scheme for formal-sector workers launched in January 2026, so far covering only public health-sector employees, with about a quarter of the eligible group registered.
How did the 2025 US foreign aid cuts affect Ethiopia’s health system?
The US paused foreign assistance, including PEPFAR-supported HIV programmes, for 90 days from 20 January 2025. In Ethiopia this terminated 5,000 US-funded public health worker contracts and 10,000 data-clerk contracts, and disrupted procurement of viral load and Early Infant Diagnosis reagents, which PEPFAR had funded in full. Regional data from three regions showed thousands of patients losing ARV treatment and HIV testing support during the pause.
Where LifeCare fits in this picture
We sell into every channel described above: EPSS and public procurement, NGO and donor-funded programmes, and the private hospitals and pharmacies that serve the patient paying out of pocket. Understanding how the money actually moves, not just where the tenders are published, is part of what keeps supply reliable across all three. If you are planning procurement against this financing picture, tell us what you need and when, or read more about our pharmaceuticals portfolio.