
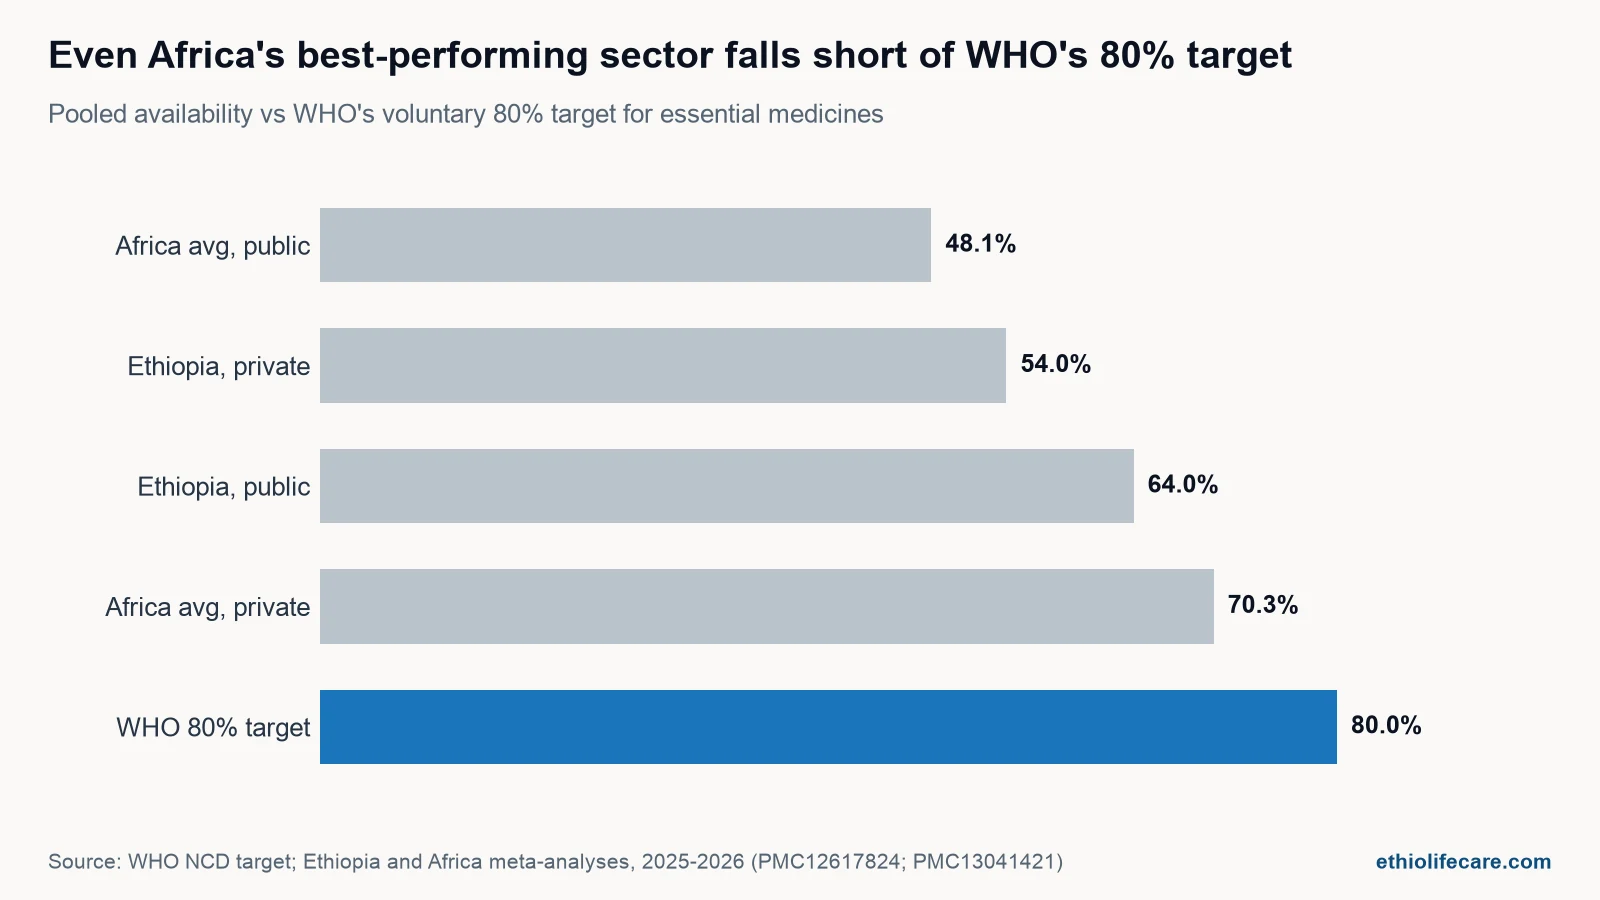
In 2013 the World Health Organization set a voluntary target: 80 percent availability of affordable essential medicines for major non-communicable diseases, in public and private health facilities alike. Ethiopia’s own facility data, pooled across 46 surveys published through August 2025, puts public-sector availability at 64 percent and private-sector availability at 54 percent (meta-analysis, 2025). Neither sector reaches the target, and Ethiopia is not unusual there. What varies, city to city and disease to disease, is by how much.
This is what the facility surveys actually show: which medicines run short, where, and by how much; what a course of treatment costs in days of a government salary; and how Ethiopia’s numbers sit against the rest of the continent. Foreign exchange access, shipping lead times and demand forecasting sit upstream of a pharmacy shelf, and all three show up in the data below.
What the WHO’s 80 percent target actually measures
The 80 percent figure comes from the WHO Global Action Plan for the Prevention and Control of Non-communicable Diseases 2013 to 2020, endorsed by the World Health Assembly that year. It asks two things at once: that a defined basket of medicines, mostly for diabetes, cardiovascular disease and respiratory disease, is in stock on the day of the survey, and that the price is affordable against local wages. A facility only counts as meeting the target if both hold (WHO Access Indicators).
Almost nowhere hits it. A secondary analysis of 54 low- and middle-income countries found that in low-income countries only 15.2 percent of public facilities and 18.9 percent of private facilities met the combined availability-and-affordability bar for the cheapest generic version of each medicine (Lancet Global Health, 2024). WHO retired the old survey-based version of SDG indicator 3.b.3 in 2025 for a composite Health Product Access Index, partly because too few countries had run a recent, comparable survey to measure against the 80 percent line. Ethiopia has kept generating that survey data anyway, through a steady stream of university-led studies using the WHO/Health Action International (WHO/HAI) methodology, which is what makes a comparison across studies possible here.
Ethiopia’s own studies, side by side
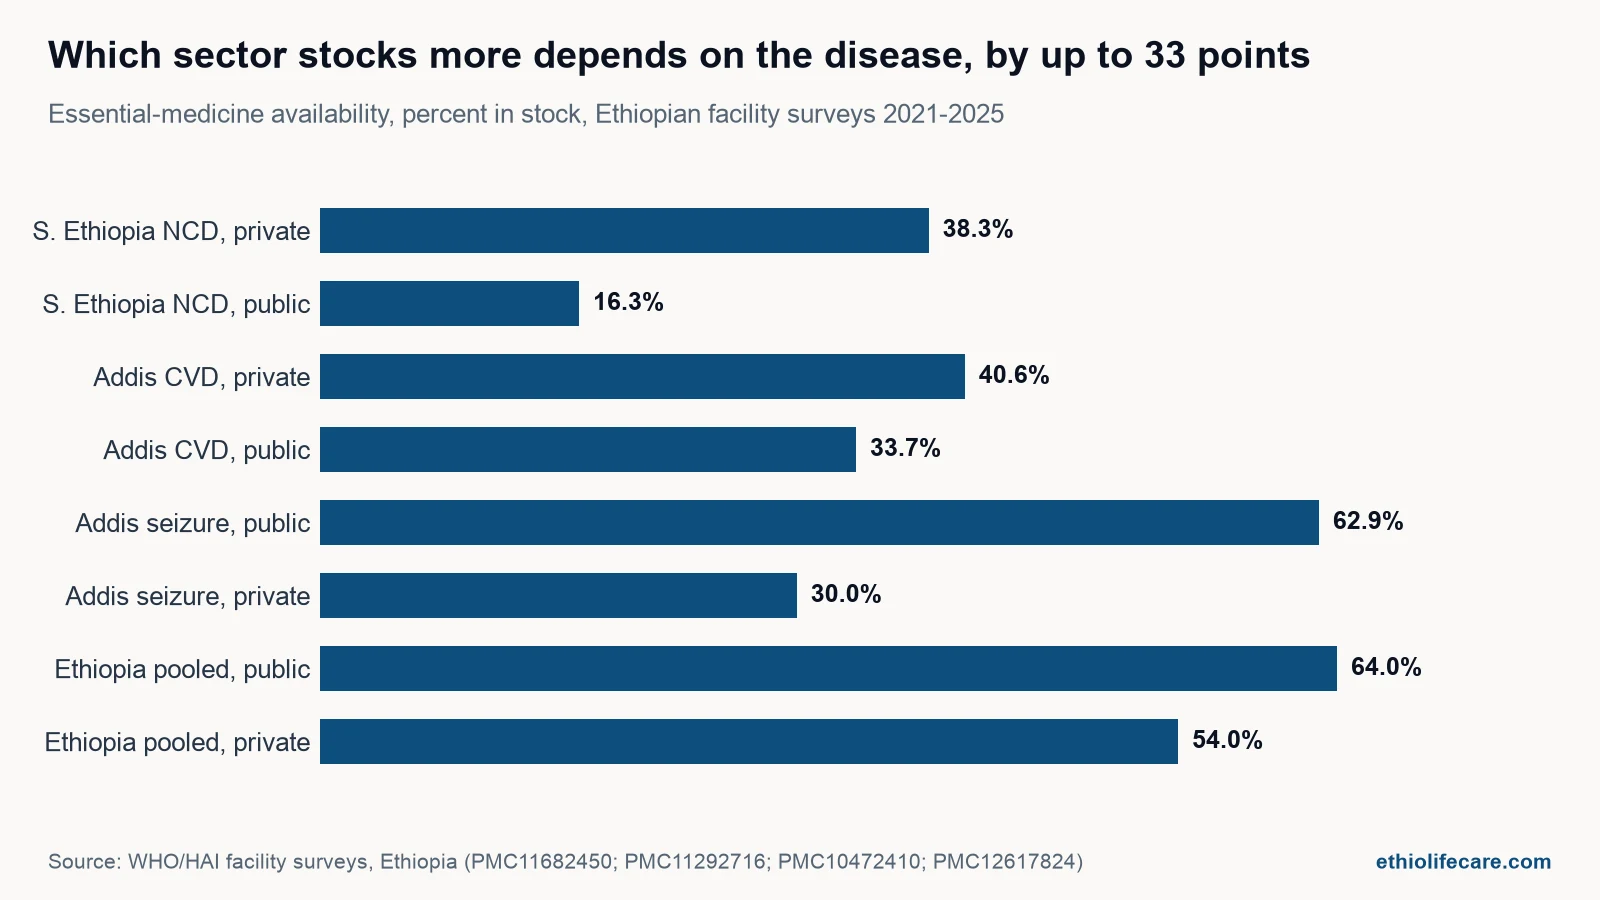
No single Ethiopian survey covers the whole country at once. Each one samples a city or zone, picks a basket of medicines tied to a specific disease group, and reports availability as the share of facilities that had the item in stock on the day of the visit. Put seven of them next to each other and a range appears that no single study shows on its own.
| Study location | Year | Sector | Medicine class | Availability |
|---|---|---|---|---|
| Addis Ababa | 2024 | Public | Cardiovascular disease | 33.7% |
| Addis Ababa | 2024 | Private | Cardiovascular disease | 40.6% |
| Arba Minch, Southern Ethiopia | 2023 | Public | Non-communicable disease | 16.3% |
| Arba Minch, Southern Ethiopia | 2023 | Private | Non-communicable disease | 38.3% |
| Central Ethiopia | 2022 | Public and private combined | Diabetes | 34.6% |
| Addis Ababa | 2022 | Public | Antiseizure | 62.9% |
| Addis Ababa | 2022 | Private | Antiseizure | 30.0% |
| Shegaw Motta General Hospital, Amhara | 2021 | Public, hospital | General tracer list | 80.0% |
| Motta Health Centre, Amhara | 2021 | Public, health centre | General tracer list | 93.3% |
| Nationwide, pooled (46 studies) | to 2025 | Public | All essential medicines | 64.0% |
| Nationwide, pooled (46 studies) | to 2025 | Private | All essential medicines | 54.0% |
Two things stand out. First, the range is wide: from 16.3 percent for non-communicable disease medicines in Arba Minch’s public facilities to 93.3 percent for a general tracer list at Motta Health Centre. A single number for “Ethiopia’s medicine availability” hides more than it tells. Second, which sector does better flips by disease. Private outlets beat public ones for cardiovascular and NCD medicines in three of the four disease-specific studies, by 7 to 22 points. Public facilities beat private ones for antiseizure medicines by almost 33 points, and the largest, most rigorous study, the 46-study meta-analysis, finds public sector ten points ahead overall. Neither sector wins consistently, which argues against treating public-versus-private as a fixed hierarchy and for checking the specific therapeutic category a buyer needs.
Stock-outs: what “available today” hides
A survey taken on one day tells a buyer whether the shelf was stocked that morning. It says nothing about whether it stayed stocked. The Shegaw Motta study tracked that separately, reviewing 15 tracer medicines over the six months before the survey. At the general hospital, 60 percent of those medicines had been stocked out at least once in that window, for an average of 38.8 days and as long as 157 days for the worst-affected item, ferrous salt with folic acid. At the neighbouring health centre, only 20 percent of medicines stocked out, for an average of 11.2 days (Amhara stock-out study, 2021).
That gap between a hospital and a health centre a few kilometres apart is the more useful finding than either number alone. It points at ordering frequency, storage capacity and distance from a distribution point, rather than at national supply as one undifferentiated problem. A hospital ordering large volumes less often absorbs a supply interruption differently than a health centre restocking in smaller, more frequent batches. For a buyer weighing an Ethiopian partner, the practical question is which of those patterns a given supplier’s own buffer stock is built to survive.
What a course of treatment actually costs
The WHO/HAI method measures affordability in one unit: the days’ wages a country’s lowest-paid government worker needs to buy one month’s standard treatment. It is a blunt tool, but it makes different price levels comparable.
- Cardiovascular disease, Addis Ababa, 2024: in the worst case, a one-month course cost the equivalent of 352.44 days’ wages, and median price ratios ran from 2.84 to 7.24 times the international reference price depending on the outlet (Masresha et al., 2024).
- Diabetes, Central Ethiopia, 2022: a month’s medicines cost 0.3 to 3.1 days’ wages in public outlets and 1.0 to 11.0 days’ wages in private ones; 84.6 percent of lowest-priced generics were unaffordable in the public sector and 58.8 percent in the private sector (Central Ethiopia survey, 2022).
- Non-communicable disease medicines, Arba Minch, 2023: every medicine surveyed in the private sector was unaffordable, and 70.4 percent were unaffordable even in the public sector (Arba Minch survey, 2023).
- Antiseizure medicines, Addis Ababa, 2022: every medicine surveyed was unaffordable, with a worst case above six months’ wages for one month of treatment (Addis Ababa antiseizure survey, 2022).
Nationally, the 46-study meta-analysis puts the pooled share of unaffordable medicines at 62 percent, with public-sector median price ratios averaging 1.45 times the international reference price and private-sector ratios averaging 3.66 times (meta-analysis, 2025). Availability and affordability move together more often than not: a medicine that is hard to find is usually also expensive where it can be found, because scarcity and thin distribution both push up the retail price.
How Ethiopia compares with the rest of Africa
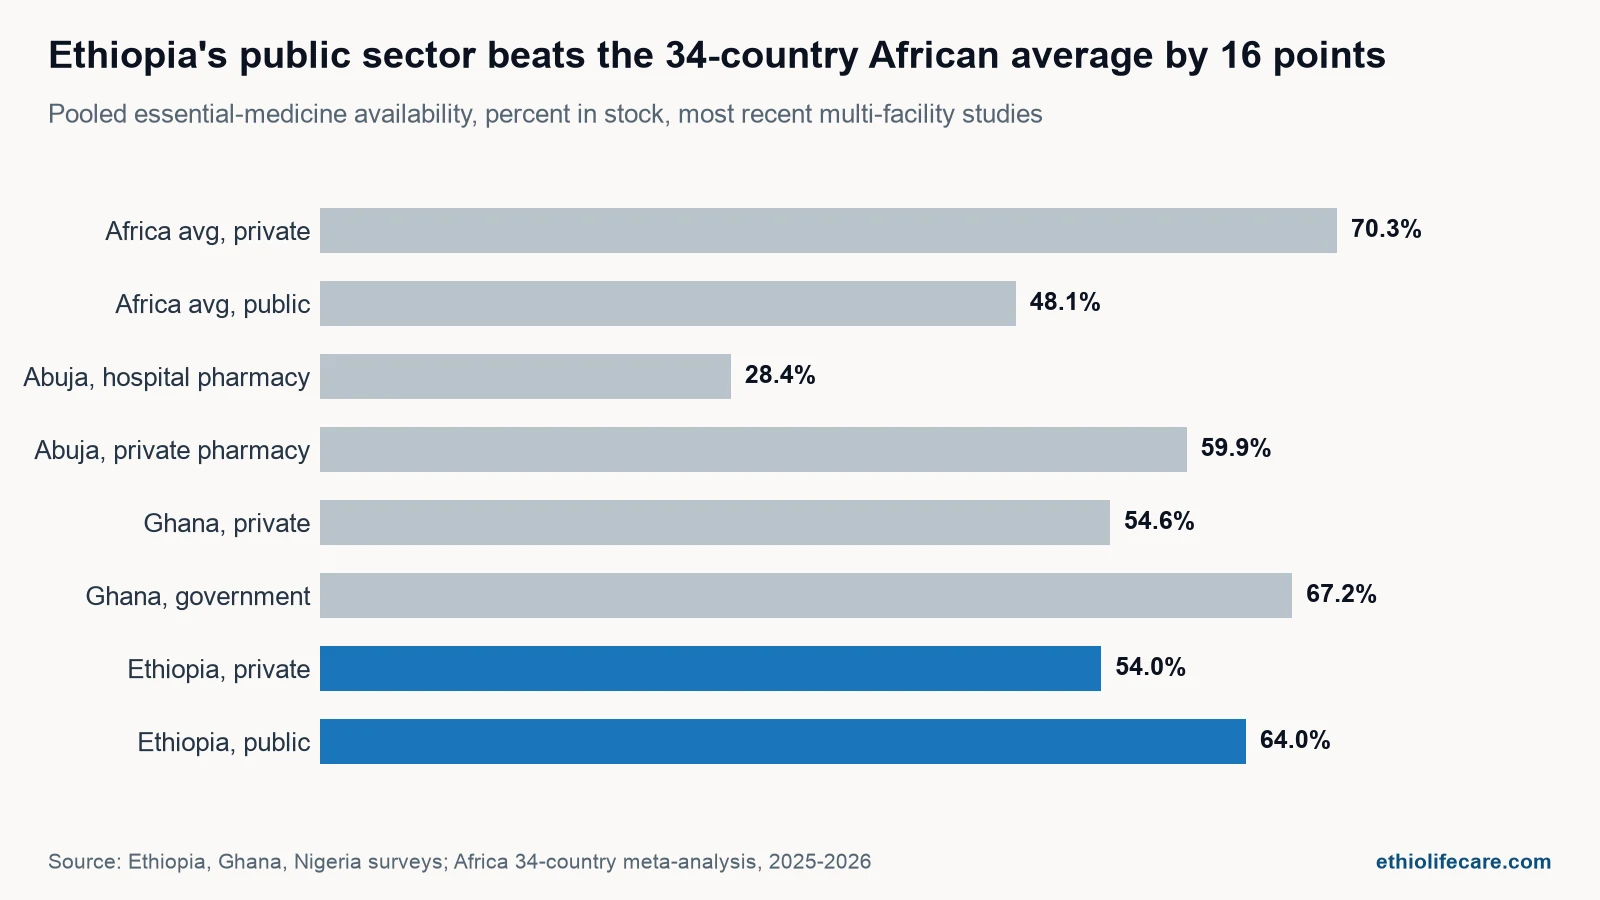
The largest single comparison point is a 2026 systematic review that pooled 52 studies across 34 African low- and middle-income countries, published from January 2014 to December 2025. It found pooled public-sector availability of 48.1 percent and private-sector availability of 70.3 percent continent-wide, with a sharp split by disease type: 59.1 percent availability for communicable disease medicines in the public sector against 37.4 percent for non-communicable disease medicines in the same sector (Albagir, BMC Public Health, 2026). The same review found that 24.1 percent of households faced catastrophic health expenditure from medicine purchases alone.
| Country or scope | Sector | Availability |
|---|---|---|
| Ethiopia, nationwide pooled | Public | 64.0% |
| Ethiopia, nationwide pooled | Private | 54.0% |
| Ghana, three municipalities | Government | 67.2% |
| Ghana, three municipalities | Private | 54.6% |
| Nigeria, Abuja | Private pharmacy | 59.9% |
| Nigeria, Abuja | Private hospital pharmacy | 28.4% |
| Africa, 34-country pooled average | Public | 48.1% |
| Africa, 34-country pooled average | Private | 70.3% |
Read this table with one caveat: these are not identical baskets measured the same year. Ethiopia’s pooled figure spans essential medicines generally, Ghana’s covers non-communicable disease medicines specifically, and Nigeria’s Abuja survey covers cardiovascular, diabetes and a set of “global” medicines. Even so, the pattern holds. Ethiopia’s public-sector figure of 64 percent sits roughly 16 points above the 34-country African public-sector average of 48.1 percent, and just above Ghana’s government-facility figure of 67.2 percent. On the private side, Ethiopia’s 54 percent trails the wider African private-sector average of 70.3 percent, pulled up by countries where private pharmacies do most retail dispensing. No African country here, public or private, clears the WHO’s 80 percent line.
Why Africa imports most of what it takes
The facility-level numbers sit on top of an import-dependent continental supply structure. Africa produces only about 3 percent of the medicines it consumes and imports more than 70 percent of them, sourced largely from India and China. Active pharmaceutical ingredients are even more concentrated: Africa imports over 95 percent of the APIs that go into locally finished products, part of why COVID-era export restrictions from China and India stalled production lines across the continent (Gavi, October 2025). Vaccines follow the same pattern: roughly 99 percent of doses administered across Africa still come from outside the continent, a figure widely cited around Africa CDC’s local-production push, though it does not trace to one single official release.
Set against that supply side, the disease burden is disproportionate. Africa carries roughly a quarter of the world’s disease burden, 25 percent by one recent estimate against just 18 percent of the global population (Gavi, October 2025), while researchers studying essential medicine access put the continent’s share of the global health workforce at around 3 percent and its share of global health spending at under 2 percent (Albagir, 2026). Quality sits on top of scarcity. WHO estimated in 2017 that roughly 1 in 10 medical products in low- and middle-income countries is substandard or falsified (WHO, 2017), and the same WHO release reported that 42 percent of the cases filed to its Global Surveillance and Monitoring System since 2013 came from the African Region, more than any other. Long supply chains with many hands on the product are where falsified medicines get in, and an import-dependent market has more of those hands than most.
What this means for buyers and for manufacturers
Ethiopia’s shortfall against the WHO target traces to the same structural pressures documented across the continent: foreign-exchange access that determines how much stock an importer can bring in at once, shipping lead times measured in weeks for anything sourced outside East Africa, and demand forecasting that is hard to get right for a health system growing as fast as Ethiopia’s. Our post on how the birr exchange rate moves medicine prices covers the forex piece in more detail.
For a hospital pharmacy head or procurement officer, the practical takeaway is to treat availability as therapy-specific rather than facility-wide. A supplier that reliably stocks cardiovascular medicines will not automatically be as reliable for antiseizure medicines, based on the spread in the table above, so a qualification process should ask about the specific product line rather than a general claim of good service. Our checklist on how to verify a medicine supplier in Ethiopia walks through what to check before a first order.
For a foreign manufacturer weighing whether Ethiopia is worth the registration effort, the gap between public and private availability, and the stock-out durations at facilities like Shegaw Motta, point at the same opening: private importers and wholesalers that carry buffer stock and diversify sourcing away from a single lead-time-heavy shipping lane fill exactly the interruptions this data documents. We cover that case in why private suppliers matter for filling drug shortages.
Frequently asked questions
What is the WHO’s target for essential medicine availability?
The World Health Organization’s Global Action Plan for Non-communicable Diseases sets a voluntary target of 80 percent availability of affordable essential medicines and basic technologies, in both public and private facilities, for major non-communicable diseases including diabetes, cardiovascular disease and respiratory disease. The target was set in 2013 for 2025. A facility only counts as meeting it if the medicine is both in stock and priced affordably relative to local wages.
What percentage of essential medicines is available in Ethiopia?
A 2025 meta-analysis pooling 46 Ethiopian facility studies found public-sector availability of 64 percent and private-sector availability of 54 percent. Individual studies vary far more widely depending on the city and disease surveyed, from 16.3 percent for non-communicable disease medicines in public facilities in Arba Minch to over 90 percent for a general tracer list at a rural health centre in Amhara.
Why are essential medicines out of stock in some Ethiopian facilities?
The facility surveys do not investigate cause directly, but the pattern points at structural, supply-side factors rather than any single point of failure: foreign-exchange access for importers bringing in medicines priced in hard currency, shipping lead times for products sourced outside the region, and the difficulty of forecasting demand accurately for a fast-growing health system. A 2021 study at two Amhara facilities found stock-out durations ranging from 10 to 157 days for individual tracer medicines, which points at resupply timing rather than at a single cause.
Are medicines more affordable in Ethiopia’s public or private pharmacies?
Public facilities are consistently cheaper by the WHO/HAI measure. Nationally, public-sector median prices average 1.45 times the international reference price against 3.66 times in private. But affordability is a separate question from availability: several studies found the public sector both cheaper and less stocked, which pushes patients into the pricier private sector simply because that is where the medicine can be found.
How does Ethiopia’s medicine availability compare with the rest of Africa?
Ethiopia’s pooled public-sector availability of 64 percent sits above the 34-country African average of 48.1 percent found in a 2026 systematic review, and close to Ghana’s government-facility figure of 67.2 percent. Ethiopia’s private-sector figure of 54 percent trails the wider African private-sector average of 70.3 percent. The comparison is not perfectly like-for-like, since the studies used different medicine baskets and years, but no country in the comparison, Ethiopia included, reaches the WHO’s 80 percent target in either sector.
Reading the gap as a market, not a verdict
LifeCare Pharmaceutical Trading imports and locally manufactures across pharmaceuticals, medical supplies and medical equipment for the Ethiopian market, working alongside the public supply system rather than around it, as an EPSS Top-20 supplier since 2022. The data in this piece is the reason a diversified, well-registered private supply base matters at all: it is what closes the distance between a facility survey’s 54 or 64 percent and the 80 percent line every regulator, hospital and patient is aiming at. If you are sourcing into Ethiopia or looking for a local partner to hold a registration and carry stock through the gaps this data documents, get in touch.