Ethiopia imported US$677.9 million worth of pharmaceutical products under HS chapter 30 in 2023, according to UN Comtrade data published through the World Bank’s WITS platform. That is the clearest, most independently checkable figure for the size of the country’s medicine trade, and a steadier starting point than the market-size estimates circulating in investor decks and blog posts, several of which trace back to a single 2019 slide.
This post works through what is actually known about Ethiopia’s pharmaceutical market: its size, the widely repeated “85% imported” claim, how many companies manufacture medicine here, what the public buyer spends, and how Ethiopia’s import bill compares with its neighbours once population is accounted for. Every number is dated and sourced. Where credible sources disagree, both are shown rather than one being quietly dropped.
What the market is actually worth, and why the estimates disagree
Every public figure for the size of Ethiopia’s pharmaceutical market traces back to one of two sources, both now a decade or closer to a decade old.
The first is the WHO’s National Strategy and Plan of Action for Pharmaceutical Manufacturing Development in Ethiopia, 2015-2025, launched July 2015. It put the annual market at US$400-500 million, growing roughly 25% a year, based on a February 2015 estimate from the then Pharmaceuticals Fund and Supplies Agency, and cites a separate 2012 Frost & Sullivan forecast of “slightly over 14%” annual growth reaching just under US$1 billion by 2018.
The second is a page on the Ethiopian Investment Commission’s website, stating that “Ethiopia’s domestic market for pharmaceutical products is estimated at US$1 billion,” growing 15% a year, projected to reach US$1.8 billion in 2025 and US$4 billion in 2030, cited directly to a “Frost & Sullivan and World Bank… PowerPoint presentation (2019).” The page also states Ethiopia’s population as 116 million, closer to 2019-2020 levels than the World Bank’s current ~132 million, evidence it has not been refreshed since.
| Estimate | Value | Growth quoted | Data vintage |
|---|---|---|---|
| WHO 2015 strategy (PFSA estimate) | US$400-500 million/year | ~25%/year | 2014/15 |
| Frost & Sullivan, cited in the same WHO document | ~US$1 billion by 2018 | ~14%/year | 2012 forecast |
| Ethiopian Investment Commission (current page) | ~US$1 billion “currently”; US$1.8bn by 2025; US$4bn by 2030 | ~15%/year | Sourced to a 2019 presentation |
No independently audited, current total-market figure turned up in this research. Anyone quoting a single dollar figure for “Ethiopia’s pharmaceutical market” in 2026 is quoting one of the two lineages above, usually without saying so.
The trade data: what Ethiopia actually paid for imported medicine, year by year
UN Comtrade tracks import value for HS chapter 30, pharmaceutical products, by reporting country. Ethiopia’s 2015-2017 figures are recorded at implausibly small amounts, almost certainly a classification gap, so the usable series starts in 2018.
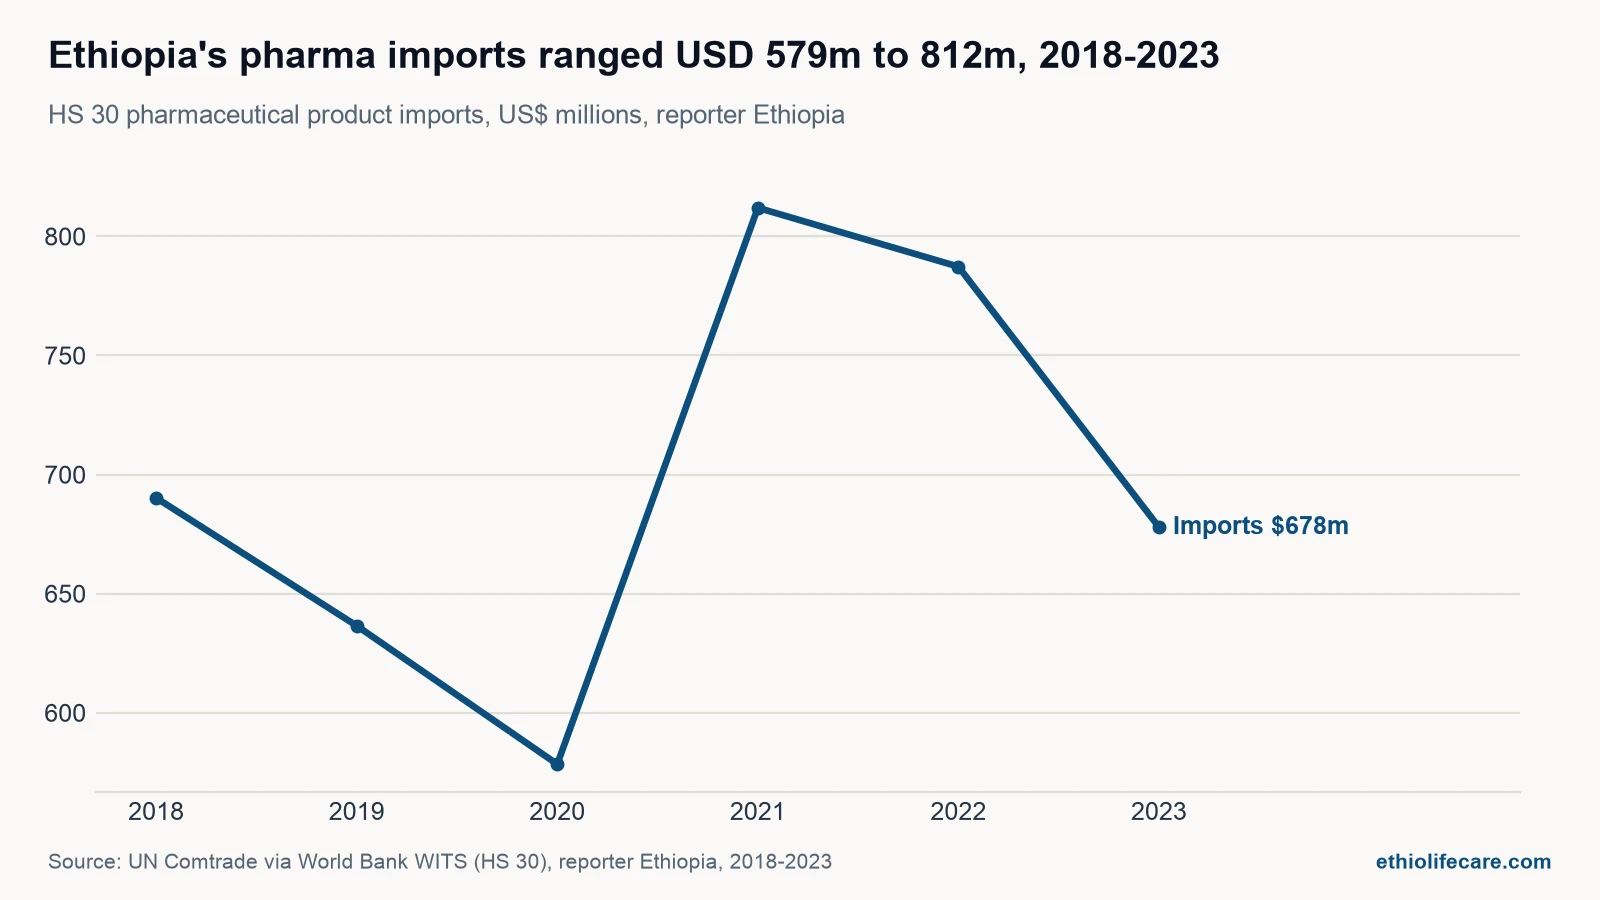
The value climbed from US$690.2 million in 2018 to a peak of US$812.0 million in 2021, then fell for two straight years to US$677.9 million in 2023. The 2021 spike and subsequent pullback line up with events unrelated to underlying demand: elevated pandemic-era health spending, then the forex shortage that tightened import permits from 2022 through the National Bank’s move to a market-based exchange rate in July 2024. The fall looks more like constrained access to foreign currency than weaker demand.
A narrower, more recent figure comes from customs-data provider NBD, which put Ethiopia’s pharmaceutical imports at US$160.95 million for H1 2025 (January-June) across more than 1,200 transactions, rising from US$24.63 million in January to US$31.93 million in June. Annualised, that points to roughly US$320-350 million for the full year, well below the Comtrade range above. The gap could reflect lower volumes after the 2024 exchange-rate reform, narrower product coverage in NBD’s data than in the full HS 30 chapter, or both, and the data cannot yet separate the two.
NBD’s H1 2025 data names India as the leading supplier at US$68.3 million across 577 transactions, followed by Belgium (US$34.0 million), China (US$15.6 million), Turkey (US$6.4 million) and Kenya (US$3.48 million).
The “85% imported” figure: where it actually comes from
A specific claim shows up across investor material and secondary blogs: that 85% (sometimes rounded to 90%) of Ethiopia’s pharmaceutical supply is imported. It has a traceable source: the same Ethiopian Investment Commission page states, next to the US$1 billion market-size figure above, “Currently, 85% of pharmaceutical supply in Ethiopia is imported, a big gap that is yet to be filled by local production,” sourced to the same 2019 Frost & Sullivan/World Bank presentation.
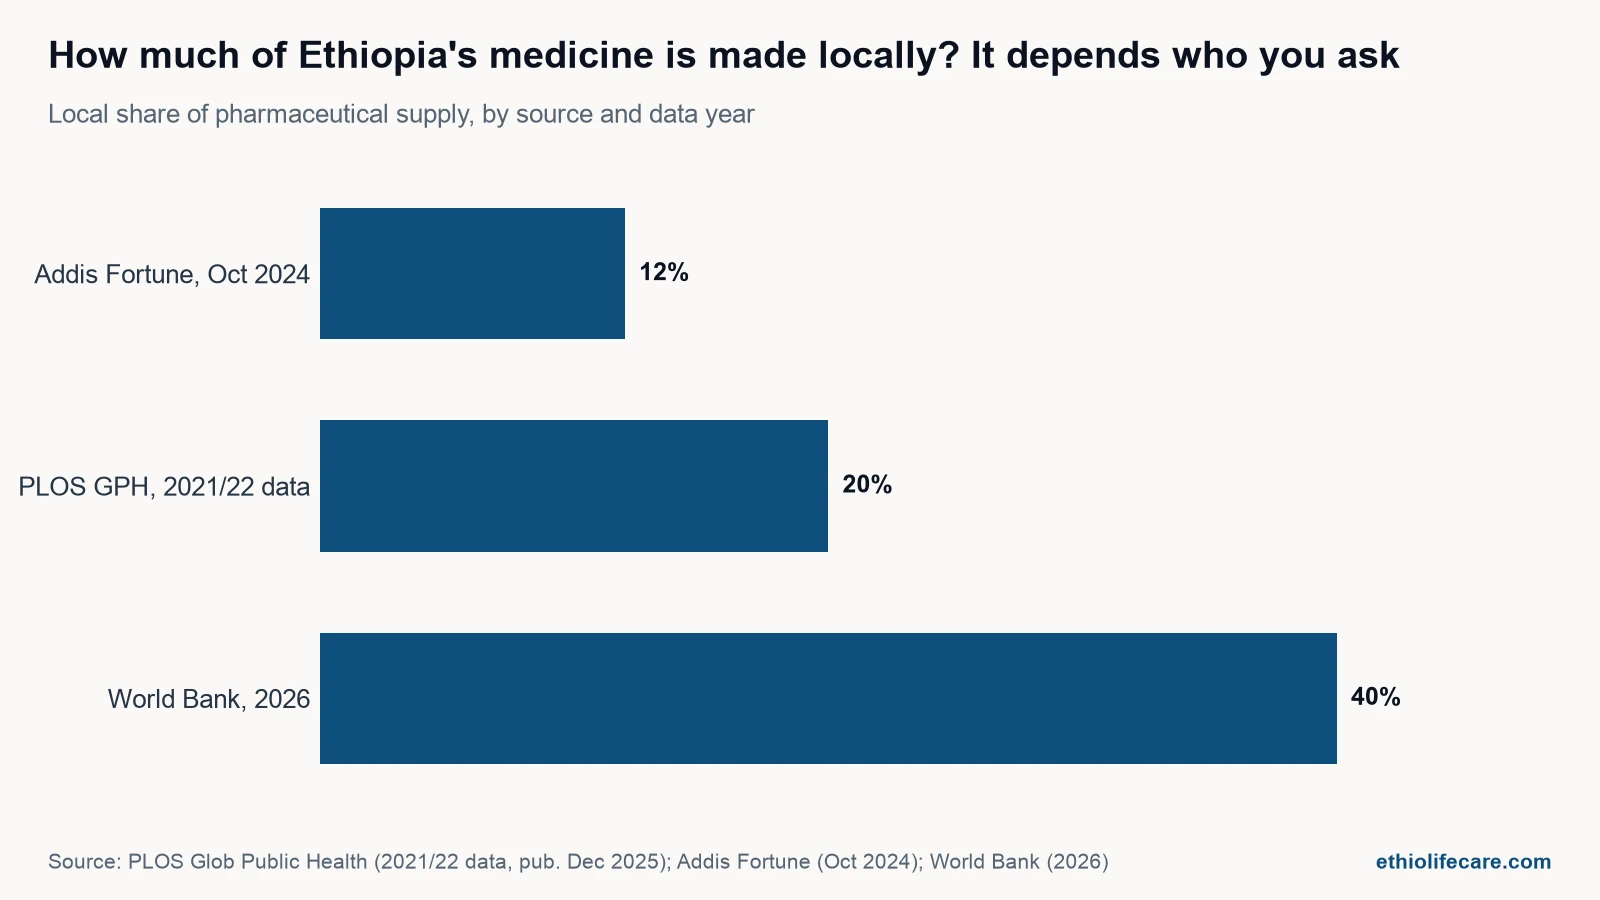
That 2019 figure is itself one step removed from a 2014/15 WHO estimate that put local manufacturers’ share of the market at about 20%, meaning roughly 80% imported. The number has been in circulation, essentially unchanged, for over a decade: a March 2026 peer-reviewed paper on manufacturing compliance still opens by citing Ethiopia’s “85% reliance on imported drugs” with no fresh source.
Meanwhile, the most recent figure from an authoritative source points a different direction. The World Bank reported in May 2026 that local production “now exceeds 40% of medicine supply,” attributed to Heran Gerba, against the national target, as the same feature frames it, of covering 50% of essential-medicine demand domestically, a genuinely different picture from “85% imported.”
The two figures are not necessarily contradictory once scope is accounted for. “Medicine supply” in the World Bank’s framing likely spans the fuller range of locally made health products, including the disposables and consumables several Ethiopian manufacturers (LifeCare’s own Gulele facility among them, producing hand sanitiser, gauze bandages, glycerine and denatured alcohol) supply alongside finished pharmaceuticals. Sources specific to finished dosage forms, covered next, tell a more modest story.
How many companies actually make medicine here
The manufacturer count has grown, but slowly, and depends on who is counting and what they count. The 2015 WHO strategy document counted approximately 200 importers alongside a local industry of 22 suppliers and manufacturers, nine of which directly manufactured pharmaceutical products, supplying about 20% of the local market and only 90 of the more than 380 medicines on the national essential medicines list.
A peer-reviewed study published in PLOS Global Public Health in December 2025, based on fieldwork carried out from October 2021 to February 2022, counted “only eleven active local pharmaceutical manufacturing companies” in Ethiopia, against 38 in Kenya. The same study found that local manufacturers, calculated against 2021/22 medicine consumption, covered 15-20% of national pharmaceutical needs, that capacity utilisation sat under 50%, that only three manufacturers fully complied with current Good Manufacturing Practice (cGMP) standards, and that over 90% of local production’s own raw materials were imported.
A more recent snapshot, from Addis Fortune, October 2024, quoted Africure Pharmaceuticals CEO Tadesse Teferi describing “the current 14 local manufacturers” as struggling “to meet a mere eight to 12pc of domestic demand, operating at only 20pc capacity,” with local share of total pharmaceutical stock “less than 12pc, down from 25pc during their prime.” The same article named five GMP-certified manufacturers, up from the three PLOS found two years earlier. A separate December 2024 piece describes the sectoral association as representing 24 members, a wider figure likely spanning medical supplies producers too.
A March 2026 study in PLOS One put the number of “large-scale pharmaceutical manufacturers” at 12, and assessed cGMP compliance at six directly: rates ranged from 62.8% to 86.7%, with only one company showing critical deviations.
| Source | Count | Data year |
|---|---|---|
| WHO strategy document | 9 manufacturers (22 local suppliers/manufacturers total) | 2014/15 |
| PLOS Global Public Health | 11 active manufacturers (vs. 38 in Kenya) | fieldwork 2021/22 |
| PLOS One | 12 large-scale manufacturers | 2024/25 |
| Addis Fortune, quoting industry CEO | 14 local manufacturers | Oct 2024 |
| EPMSMA sectoral association membership | 24 members (broader scope) | Dec 2024 |
EPSS: the public buyer’s footprint
The Ethiopian Pharmaceuticals Supply Service is the dominant public purchaser of medicines. The 2015 WHO strategy document recorded the service’s predecessor, the Pharmaceuticals Fund and Supplies Agency, procuring “almost 70%” of all medicines consumed in Ethiopia, with its own procurement budget growing from US$27 million in 2007 to US$310 million in 2014. No comparably clean, current percentage-of-market figure for EPSS was found, but its scale today is not in question.
In an August 2026 briefing reported by The Reporter Ethiopia, EPSS Director-General Abdulqadir Gelgelo said the service had signed medicine procurement contracts worth 24 billion Birr in the last fiscal year, covering 5,000 health facilities under its contract-based supply system, of which 98% came to collect what they had ordered. Health institutions collected medicines worth close to 16.3 billion Birr against those contracts, roughly 70% fulfilment at the contract level. He also reported that the share of medicines facing inadequate supplier availability had fallen from 27% four years earlier to 16% now.
The 2015 strategy’s targets, a decade on
The 2015 National Strategy and Plan of Action for Pharmaceutical Manufacturing Development set a headline goal: raise local production from around 20% to 60% by 2025, alongside subsidiary targets of 15 WHO-prequalified locally-made products and 1,500 industrial pharmacy graduates, a target still described as live in a March 2025 review in Frontiers in Medicine.
None of the figures gathered show 60% reached. Depending on source and scope, local production sits somewhere between roughly 12% (Addis Fortune, October 2024) and “more than 40%” (World Bank, May 2026). What has visibly advanced is infrastructure and regulatory standing rather than output: the Kilinto Special Economic Zone now offers roughly 160-166 hectares for manufacturers, and Ethiopia became the ninth African country, first in IGAD, to reach WHO Maturity Level 3.
The manufacturers’ own sectoral association has since set a narrower, later target: raise capacity utilisation to 70% and add 20 new manufacturers within five years of its October 2024 announcement, covering 70% of local medical-product needs by 2030, a more modest ambition than the original 2025 strategy target, and a sign of how the sector’s own leadership now reads the gap between plan and output.
Ethiopia against its neighbours: import spend per person
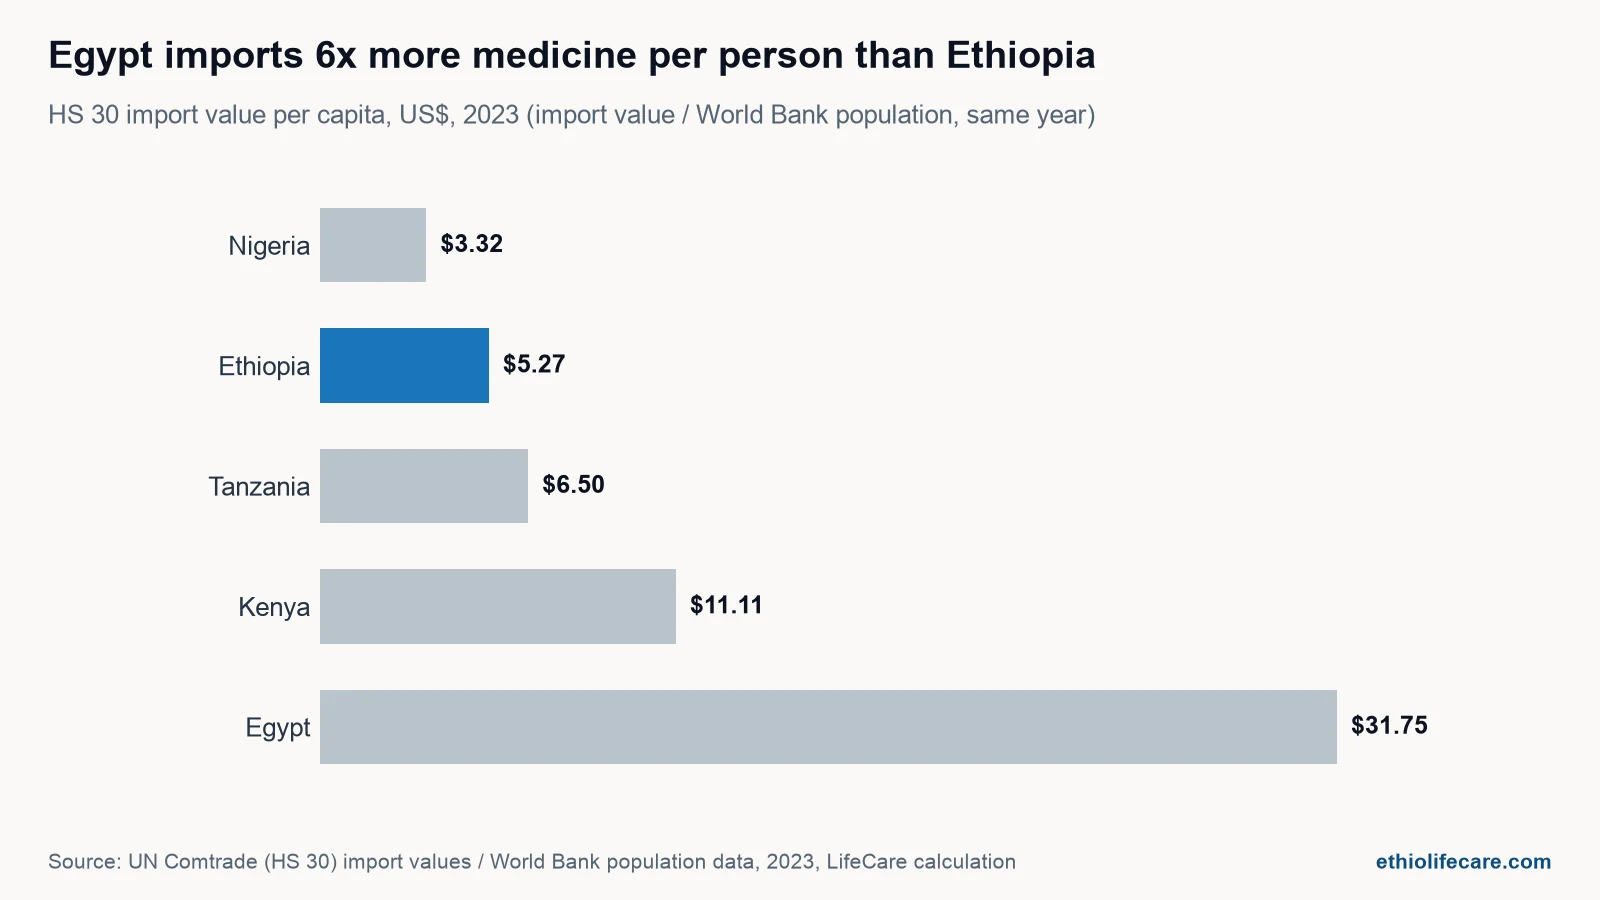
A raw import total says little on its own; a bigger, richer country will naturally import more medicine in absolute terms. To compare fairly, we divided each country’s 2023 UN Comtrade HS 30 import value by its 2023 World Bank population, same year for both, for Ethiopia and four peers: Kenya, Nigeria, Egypt and Tanzania. This calculation does not appear pre-packaged anywhere in this research; it is original to this post, and the working is shown in full below.
| Country | HS 30 imports, 2023 | Population, 2023 | Import value per person |
|---|---|---|---|
| Egypt | US$3,636.3 million | 114,535,772 | US$31.75 |
| Kenya | US$614.6 million | 55,339,003 | US$11.11 |
| Tanzania | US$433.2 million | 66,617,606 | US$6.50 |
| Ethiopia | US$677.9 million | 128,691,692 | US$5.27 |
| Nigeria | US$756.6 million | 227,882,945 | US$3.32 |
Egypt imports roughly six times more medicine per person than Ethiopia, consistent with Egypt’s larger, more mature pharmaceutical and API-import trade rather than proof of a healthier population. Kenya and Tanzania both import more per person than Ethiopia despite smaller populations, while Nigeria, the largest population of the five by far, imports the least per person, a sign its own manufacturing base absorbs more of its demand. A low per-capita figure is not automatically good news: it can reflect successful import substitution, or medicine people simply cannot get. Both readings are consistent with Ethiopia’s manufacturing data above.
What this means for buyers
Two things follow for a hospital pharmacy head or procurement officer. First, Ethiopia’s import bill for finished medicine moves with the exchange-rate and forex-allocation cycle, not just demand, so a supplier’s currency access and import-licence standing matter as much as its price list. Second, with local manufacturers covering somewhere between roughly one-eighth and two-fifths of the market depending on how the figure is drawn, most categories will keep depending on a supplier who can manage both import logistics and EFDA registration competently. Our guide on how to import medicine into Ethiopia covers what that involves.
What this means for manufacturers
For a foreign manufacturer weighing up Ethiopia, the honest read is a country mid-transition rather than transformed. Regulatory standing has genuinely improved (WHO Maturity Level 3, a dedicated industrial zone at Kilinto). But the local manufacturing base remains small by regional standards (Kenya’s manufacturer count alone is more than three times Ethiopia’s), capacity utilisation is still cited under 50%, and raw-material import dependence sits above 90% even among local producers. That combination favours partnership and local-agent models over standalone market entry for most manufacturers, which is why the EPSS supplier base still runs mostly through registered importers and agents, a dynamic we cover in our recap of the 5th EPSS International Suppliers Conference.
Where LifeCare sits in this picture
LifeCare sits on both sides of the numbers in this post: an importer and wholesaler with 225-plus EFDA registrations and an EPSS Top-20 supplier record from 2022 to 2025, and a local manufacturer at our Gulele facility, producing hand sanitiser, gauze bandages, glycerine and denatured alcohol. That hybrid position is common among the companies in the manufacturer counts above; several established local producers started as importers. If you manufacture abroad and are assessing Ethiopia, our partners page shows how we work with international manufacturers already here.
Frequently asked questions
How big is Ethiopia’s pharmaceutical market in 2026?
There is no single audited figure. Estimates trace back to either a 2014/15 WHO-cited figure of US$400-500 million growing around 25% a year, or an Ethiopian Investment Commission page sourced to a 2019 presentation putting the market at roughly US$1 billion, projected to reach US$4 billion by 2030. UN Comtrade’s HS 30 import data, narrower but independently checkable, put Ethiopia’s pharmaceutical import value at US$677.9 million in 2023.
Is it true that 85% of Ethiopia’s medicine is imported?
That figure traces back to an Ethiopian Investment Commission page citing a 2019 presentation, itself descended from a 2014/15 estimate, and has been repeated largely unchanged since. The most recent figure available, from the World Bank in May 2026, puts local production above 40% of “medicine supply,” implying an import share closer to 60% or below on that broader measure. Figures specific to finished pharmaceutical products put the local share lower, around 12-20% depending on source and year. No single current, reconciled percentage exists.
How many pharmaceutical manufacturers does Ethiopia have?
Depending on source and year: 9 manufacturers in 2014/15 (WHO), 11 active manufacturers based on 2021/22 fieldwork (PLOS Global Public Health, Dec 2025), 12 large-scale manufacturers as of 2024/25 (PLOS One, March 2026), 14 as of October 2024 (Addis Fortune, quoting an industry CEO), and 24 sectoral association members as of December 2024, a wider category including medical supplies producers. No official current-year EFDA or Ministry of Industry count was found.
Which country supplies most of Ethiopia’s imported medicine?
India, by a wide margin. NBD recorded India supplying US$68.3 million of Ethiopia’s US$160.95 million in H1 2025 pharmaceutical imports, ahead of Belgium (US$34.0 million), China (US$15.6 million), Turkey (US$6.4 million) and Kenya (US$3.48 million).
How does Ethiopia’s medicine import spend compare with other African countries?
On a per-person basis using 2023 UN Comtrade and World Bank data, Ethiopia imported about US$5.27 of pharmaceutical products per capita, ahead of only Nigeria (US$3.32) among the five countries compared here. Tanzania (US$6.50), Kenya (US$11.11) and Egypt (US$31.75) all imported more per person. A lower figure can reflect successful local production or constrained access, and both dynamics show up in Ethiopia’s manufacturing data.